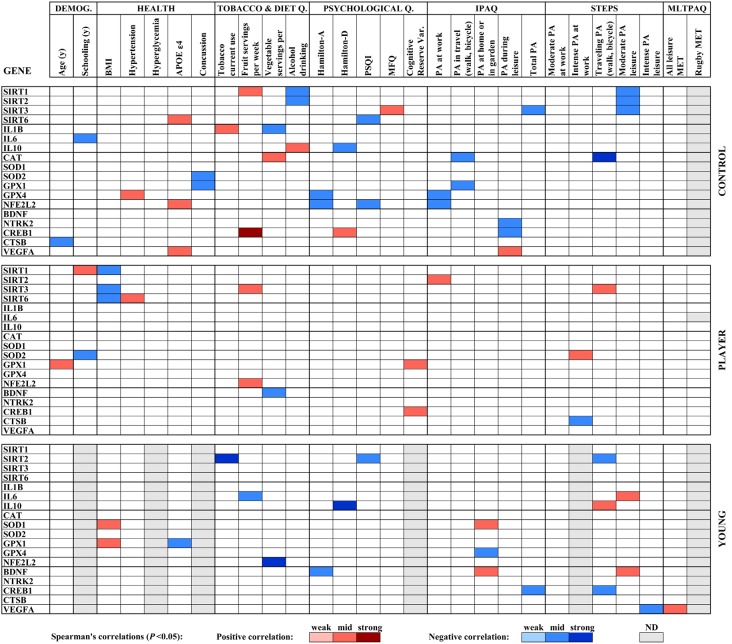
Figure 3.
Heat map built with Spearman’s correlations between gene expression analysis and sociodemographic, health, diet and physical activity parameters obtained by standardized questionnaires. Potency of significant correlations (P < 0.05) were defined as weak (/R/ < 0.400), moderate (0.400 ≤ /R/ < 0.600) or strong (/R/ ≥ 0.600), as shown by color code.

