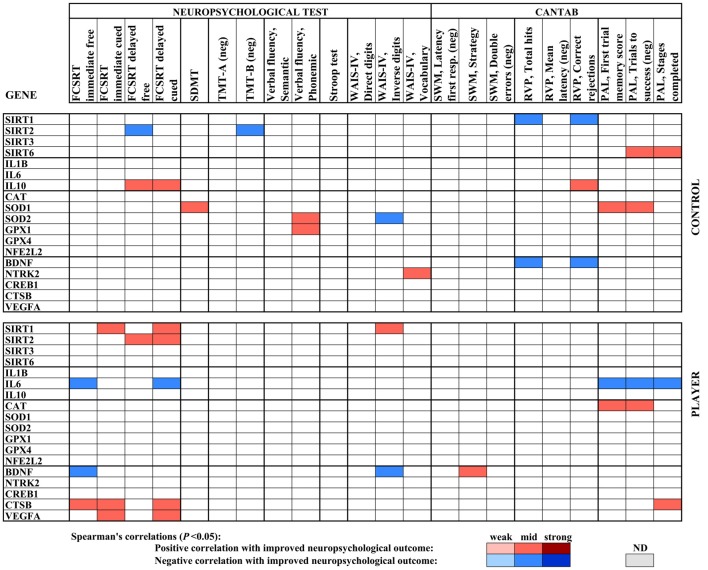
Figure 4.
Heat map built with Spearman’s correlations between gene expression analysis and neuropsychological parameters of the middle age cohort. The sign of the correlation coefficient is reversed where the better neuropsychological outcome is measured by the lower value of the parameter, as indicated (neg). Potency of significant correlations (P < 0.05) were defined as weak (/R/ < 0.400), moderate (0.400 ≤ /R/ < 0.600) or strong (/R/ ≥ 0.600), as shown by color code.

