Figure 5.
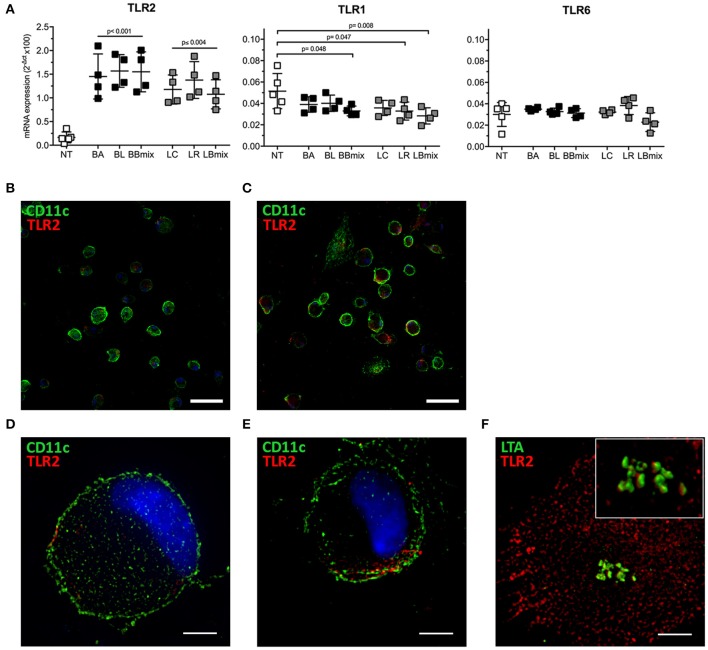
Differential expression of TLRs in BMDCs exposed to probiotics. (A) qRT-PCR analysis of TLR2, TLR1, and TLR6 in BMDCs exposed to single strains (BA, BL, LC, LR) and combinations (BBmix, LBmix) of probiotics for 4 h (mean ± SD). (B) Confocal and (D) SIM images of untreated CD11c+ cells (green) and TLR2 (red). (C) Confocal and (E) SIM images of LR-exposed CD11c+ cells (green) and TLR2 (red). (F) SIM image of LTA (green) and TLR2 (red) of BMDCs exposed to LC (inset: 3D volume). Statistical significance was assessed by one-way ANOVA test with Dunnett's multiple comparison test. Corrected p-values are reported. Confocal image scale bar: 50 μm; SIM image scale bar: 5 μm.

