
Figure 3.
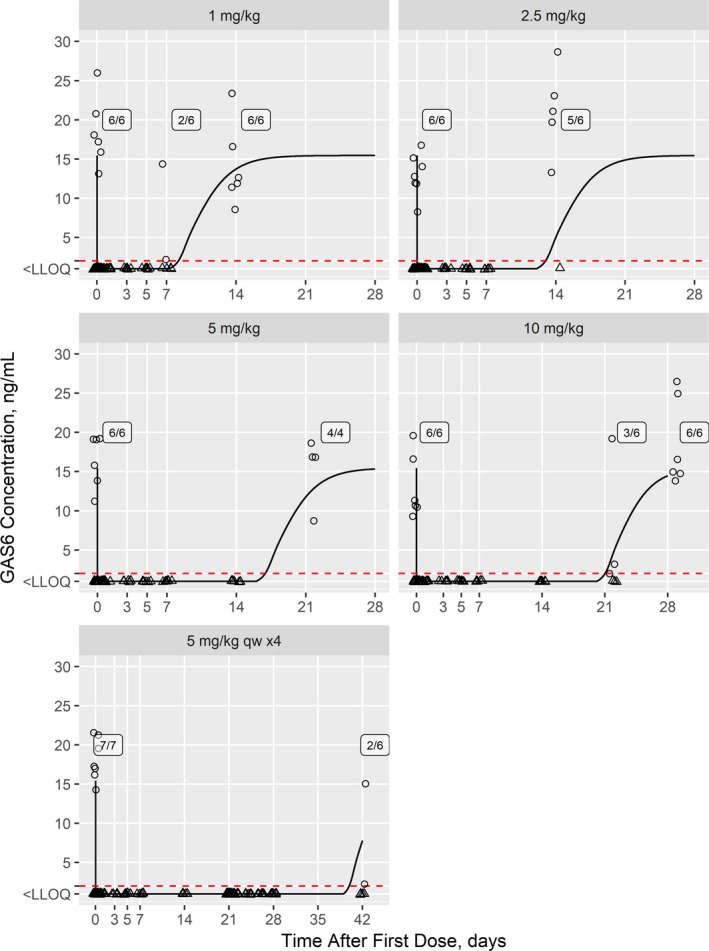
Model‐predicted growth arrest‐specific 6 (GAS6) concentrations for the first‐in‐human study with observed concentrations overlaid. Individual observations (points) are shown overlaid with the model‐predicted values (lines) for a typical 75 kg subject. Observations and predictions below the LLOQ (2 ng/mL; dashed red line) are shown at LLOQ/2 and as triangles. Counts of subjects where GAS6 levels are above the LLOQ are shown. LLOQ, lower limit of quantitation.