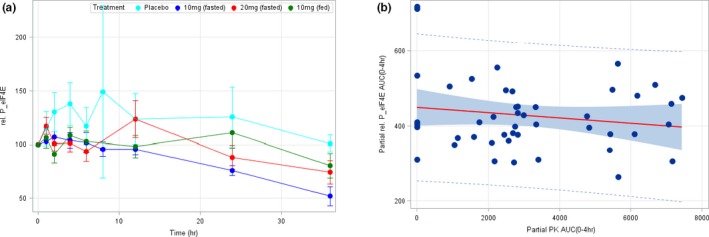
Figure 4.

Relative phosphorylation of eIF4E (p‐eIF4E) mean time course levels in peripheral blood mononuclear cells (PBMCs); correlation of ETC‐206 partial area under curve (AUC) with p‐eIF4E partial AUC. (a) Mean relative p‐eIF4E levels in PBMCs (± SD) for placebo and at the doses of 10 mg (fasted), 20 mg (fasted), and 10 mg (fed). (b) Correlation between the partial AUC (0–4 hour) of the PK concentration‐time curve and the partial AUC (0–4 hour) of the relative p‐eIF4E levels in PBMCs (P = 0.00566). The solid red line represents the regression line, the shaded area represents the 95% confidence limits, and the dotted lines identify the 95% prediction limits. AUC, area under the concentration‐time curve; PK, pharmacokinetic.
