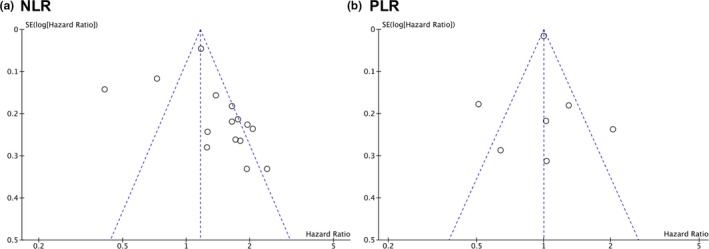
Figure 3.

Funnel plot for (a) neutrophil/lymphocyte ratio (NLR) and (b) platelet/lymphocyte ratio (PLR). The funnel plot demonstrates whether there is evidence of publication bias in the studies that evaluated prognostic significance of preoperative NLR and PLR. Dotted lines, pseudo 95% confidence limits.
