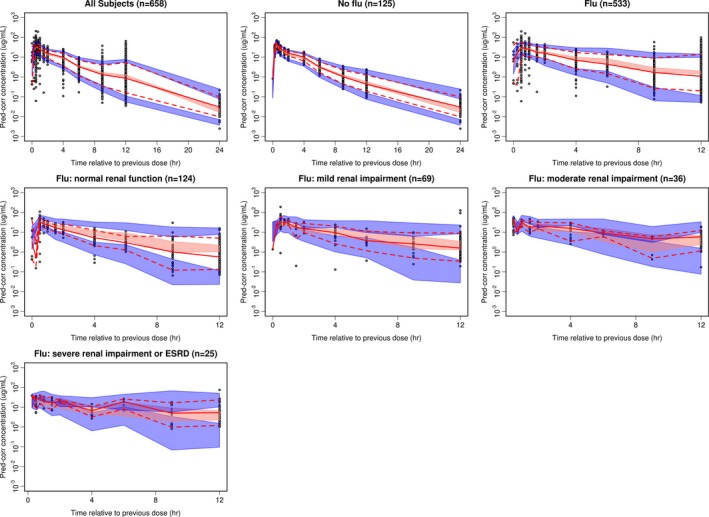
Figure 2.

Prediction‐corrected visual predictive check plots for final model with no stratification and stratification on patient type and renal function. In all these plots, black circles are observations; red solid and dash lines represent the median (solid line), 5th and 95th percentiles (dash lines) of the observations; the shaded region are the 95% confidence intervals (2.5–97.5th percentiles) around the median (pink), 5th and 95th percentiles (blue) based on model simulations. Y axis corresponds to plasma concentrations. ESRD, end‐stage renal disease.
