Figure 3.

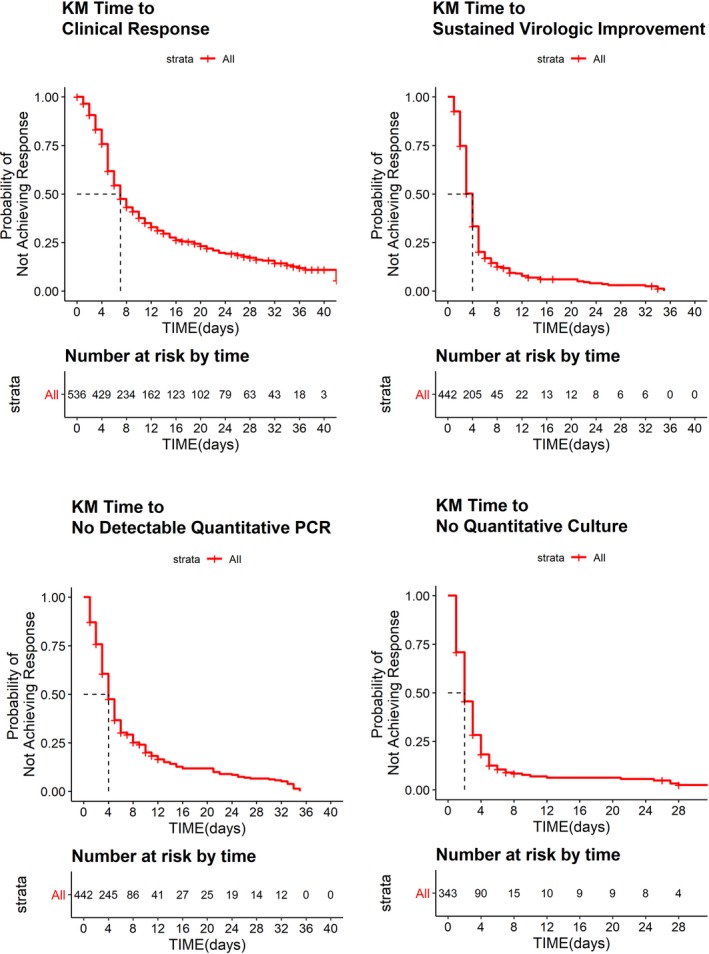
Raw Kaplan–Meier (KM) curves for time‐to‐event analyses. Red lines mark median time to response for each end point. PCR, polymerase chain reaction.

Raw Kaplan–Meier (KM) curves for time‐to‐event analyses. Red lines mark median time to response for each end point. PCR, polymerase chain reaction.