
Figure 4.
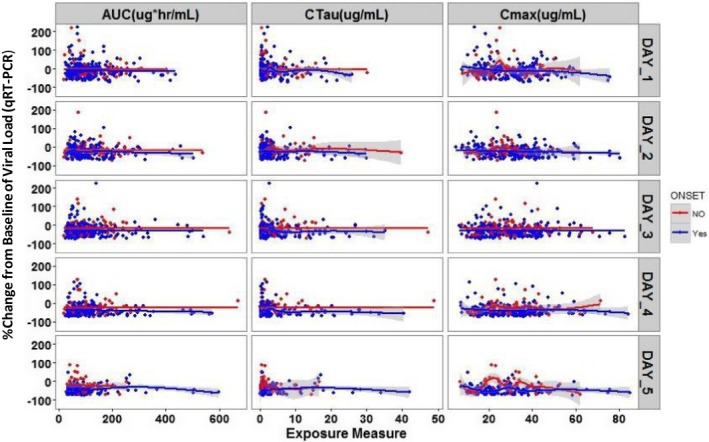
Change from baseline in viral load (quantitative real‐time polymerase chain reaction (qRT‐PCR)) by average exposure and by day. In all these plots, blue dots are observations and blue line is local regression smoothing line (95% confidence interval (CI) shaded region) for individuals who had symptom onset within 4 days before start of zanamivir treatment; red dots are observations and red line is local regression smoothing line (95% CI shaded region) for individuals who had symptom onset > 4 days before the start of zanamivir treatment. Time on x‐axis is day relative to baseline measure. Unit for qRT‐PCR is copies/mL. AUC, area under the curve; Cmax, peak plasma concentration; Ctau, trough concentration.