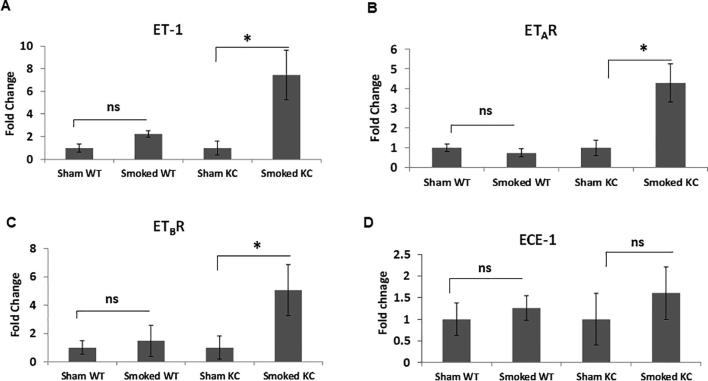
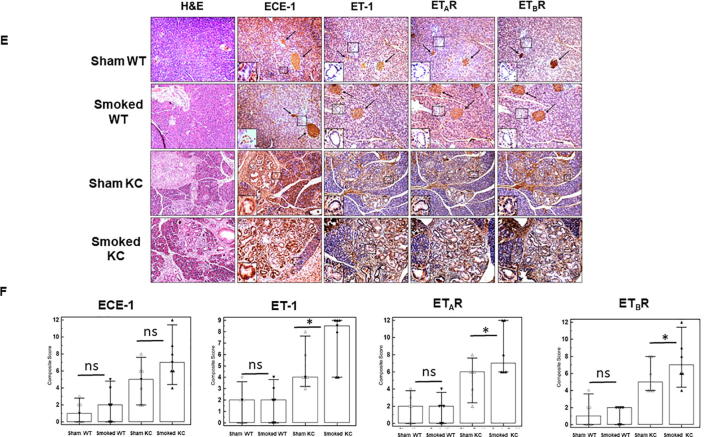
Fig. 4.
Alterations in the expression of ET axis components (ECE-1, ET-1, ETAR and ETBR) in the pancreas of sham or cigarette smoke exposed WT and KC mice. qRT PCR was performed on the mRNA isolated from the pancreas of the WT or KC mice that were exposed to cigarette smoke or sham treated. The histograms represent fold change in the transcripts of ET axis components, ECE-1 (A), ET-1 (B), ETAR (C) and ETBR (D) transcripts in smoke exposed mice as compared to sham treatment. Immunohistochemistry analysis of the ET axis components in the pancreas of WT and KC mice that were either sham treated or exposed to cigarette smoke (E). Islets are marked with arrows and ducts are marked in boxes and zoomed in insets. The first column shows H & E stained section to demonstrate histological changes due to mutant K-ras or smoke exposure. Box plots (F) represent the composite scores for ET axis components. (n = 3 each group for RT-PCR and n = 6 each group for IHC; * p < 0.05, ns = non-significant).


