Figure 2.

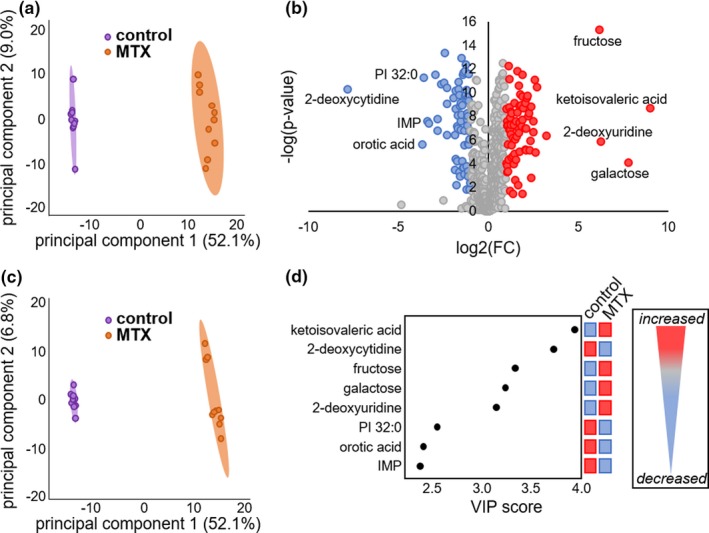
Identification of key metabolites associated with cellular response to methotrexate (MTX) by univariate and multivariate analysis of 724 identified metabolites. Metabolomics data were analyzed using MetaboAnalyst 3.0 and the resulting (a) principle component analysis scores plot, (b) volcano plot, (c) partial least squares discriminant analysis scores plot, and (d) variable importance in projection (VIP) score plot are presented. In the volcano plot, red‐colored metabolites represent those metabolites found to be increased in the MTX treated group, whereas the blue‐colored metabolites represent those metabolites that were found to be decreased and statistically significant metabolites (false discovery rate adjusted P value < 0.05) with a > 10‐fold change are labeled on the volcano plot. The top discriminating metabolites are presented in the VIP score plot and are the same metabolites identified in the volcano plot. FC, fold change; IMP, inosine monophosphate; PI, phosphatidylinositol.
