
Figure 3.
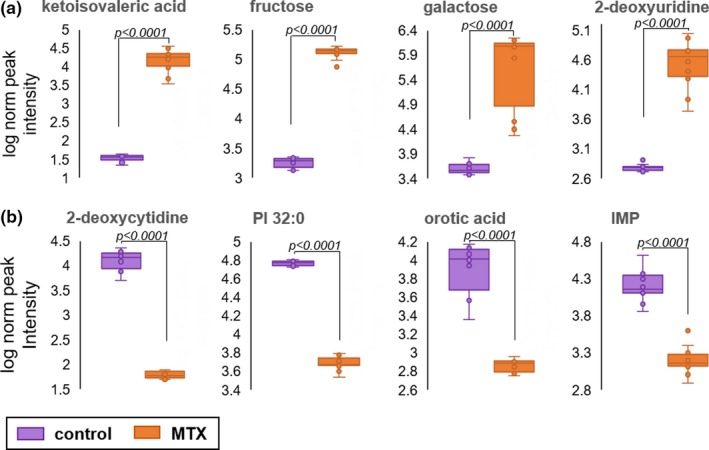
Relative abundance of metabolomic markers of methotrexate (MTX) response. The normalized peak ion intensity plots for the eight metabolites identified by univariate and multivariate analyses are presented. (a) Metabolites found to be increased in MTX‐treated cells includes ketoisovaleric acid, fructose, galactose, and 2‐deoxyuridine. (b) Metabolites found to be decreased in MTX‐treated cells includes 2‐deoxycytidine, phosphatidylinositol (PI) 32:0, orotic acid, and inosine monophosphate (IMP). Normalized peak ion intensity data were collected from 10 samples per group over three independent experimental evaluations. Data points and representative box and whisker plots are shown based on metabolomics analysis after 24 hours of exposure to either vehicle control or 1,000 nM MTX. Normalized peak ion intensities were compared between groups using unpaired nonparametric analysis with unequal variances. The resulting false discovery rate adjusted P values are provided.