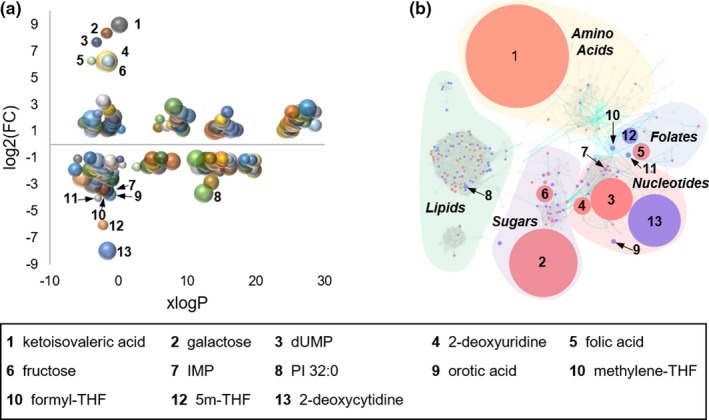
Figure 4.

Chemometric and metabolic network mapping of metabolomic and targeted metabolic profiling data. (a) Metabolomic data combined with data from targeted analysis of folates and select intermediates of nucleotide biosynthesis was assessed based on lipophilicity, fold‐change (FC), and false discovery rate adjusted P value; with node size directly proportional to the inverse log of the P value for each metabolite. (b) A chemometric and metabolic network map was built using MetaMapp and visualized using Cytoscape. Red denotes metabolites found to significantly increase with methotrexate (MTX) treatment and blue denotes metabolites found to significantly decrease in cells treated with MTX. Node size is directly proportional to measured FC. Blue lines between nodes represent Kyoto Encyclopedia of Genes and Genomes reaction pairs, whereas gray lines represent pairing based on chemical similarity. Metabolites found to be significantly altered with a greater than 10‐fold change are labeled by number with the corresponding metabolite name provided in the key.
