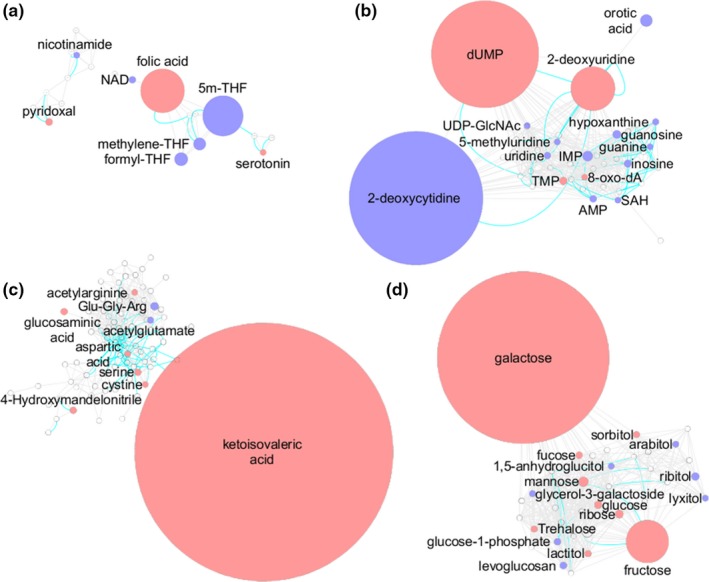
Figure 5.

Key metabolic pathways associated with pharmacological activity of methotrexate (MTX) in K562 cells. The metabolic network built in Cytoscape was divided into clusters using the community cluster tool within Cytoscape. The resulting clusters represent (a) folate‐related metabolites, (b) nucleotides, (c) amino acids, and (d) carbohydrates. Red denotes metabolites found to significantly increase with MTX treatment and blue denotes metabolites found to significantly decrease with MTX treatment. Node size is directly proportional to measured fold‐change. Blue lines between nodes represent Kyoto Encyclopedia of Genes and Genomes reaction pairs, whereas gray lines represent pairing based on chemical similarity. 5m‐THF, 5‐methyl‐tetrahydrofolate; dUMP, deoxyuridine monophosphate; IMP, inosine monophosphate; SAH, S‐adenosyl‐homocysteine; THF, tetrahydrofolate; TMP, thymidine monophosphate.
