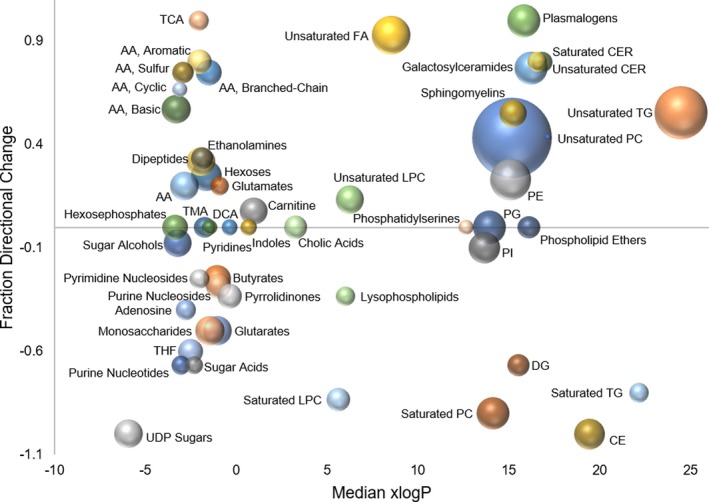
Figure 6.

Association of methotrexate (MTX) pharmacological activity with changes by chemical group classification using chemical similarity enrichment analysis. Metabolomics data were analyzed using ChemRICH open source software to produce nonoverlapping chemical group classifications that was able to map 671 of the identified metabolites to 62 nonoverlapping chemical classes, of which 50 were found to be statistically significantly different between the MTX treated and control group (false discovery rate adjusted P value < 0.05). For each group of chemicals the fraction directional change is plotted as a function of the median xlogP and node size is directly proportional to the negative logarithm of the P value.
