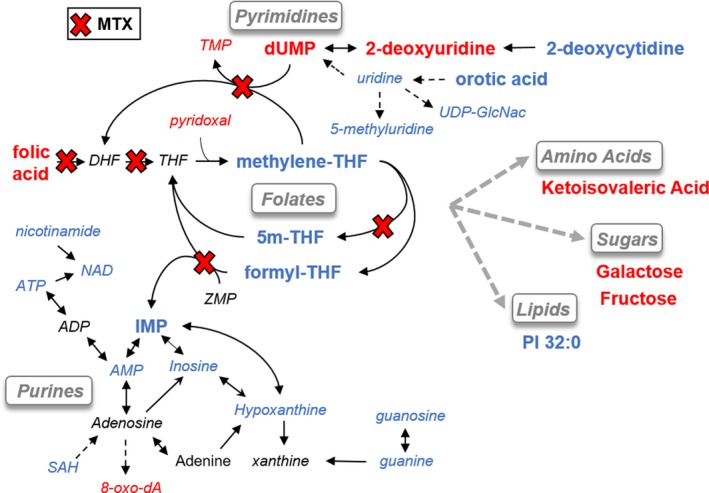
Figure 7.

Mapping of biochemical data onto known pharmacologic targets of methotrexate (MTX). An illustration of the major metabolic pathways targeted by MTX is depicted and the findings of this study are shown based on the color and size of the labeled metabolites. Specifically, metabolites with large font represent metabolites with a > 10‐fold change following treatment with MTX, red font color indicates a decrease in the metabolite, blue font color represents an increase in the metabolite, and black font color represents a nonstatistically significant change in the measured metabolite. Known enzymatic targets of MTX and its metabolites are marked by a red “X.” 5m‐THF, 5‐methyl‐tetrahydrofolate; ATP, adenosine triphosphate; dUMP, deoxyuridine monophosphate; IMP, inosine monophosphate; PI, phosphatidylinositol; SAH, S‐adenosyl‐homocysteine; THF, tetrahydrofolate; TMP, thymidine monophosphate; UDP‐GlcNAc, uridine diphosphate N‐acetylglucosamine.
