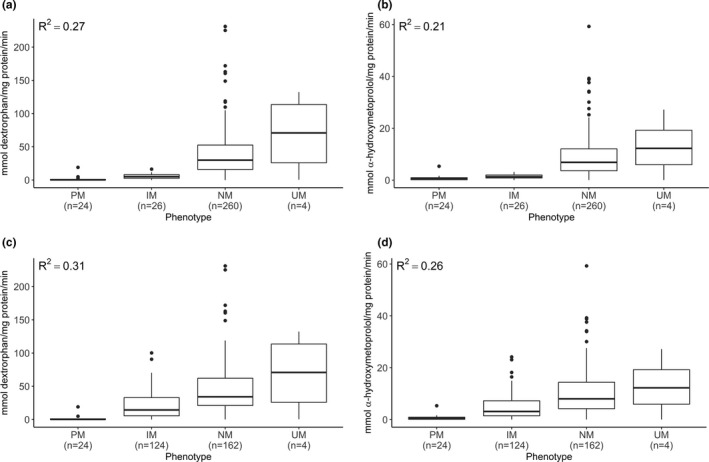
Figure 4.

Comparison between current and revised Clinical Pharmacogenetics Implementation Consortium (CPIC) genotype to phenotype translation tables for dextromethorphan and metoprolol. Dextrorphan formation rate by phenotype (IM, intermediate metabolizer; NM, normal metabolizer; PM, poor metabolizer; UM, ultrarapid metabolizer) assigned with current (a) and revised (c) CPIC definitions; alpha‐hydroxymetoprolol formation rate by phenotype assigned with current (b) and revised (d) CPIC definitions. Boxes represent interquartile range with interior line representing the median. Error bars represent 1.5× the interquartile range. Number of samples in each phenotype category is given in parentheses.
