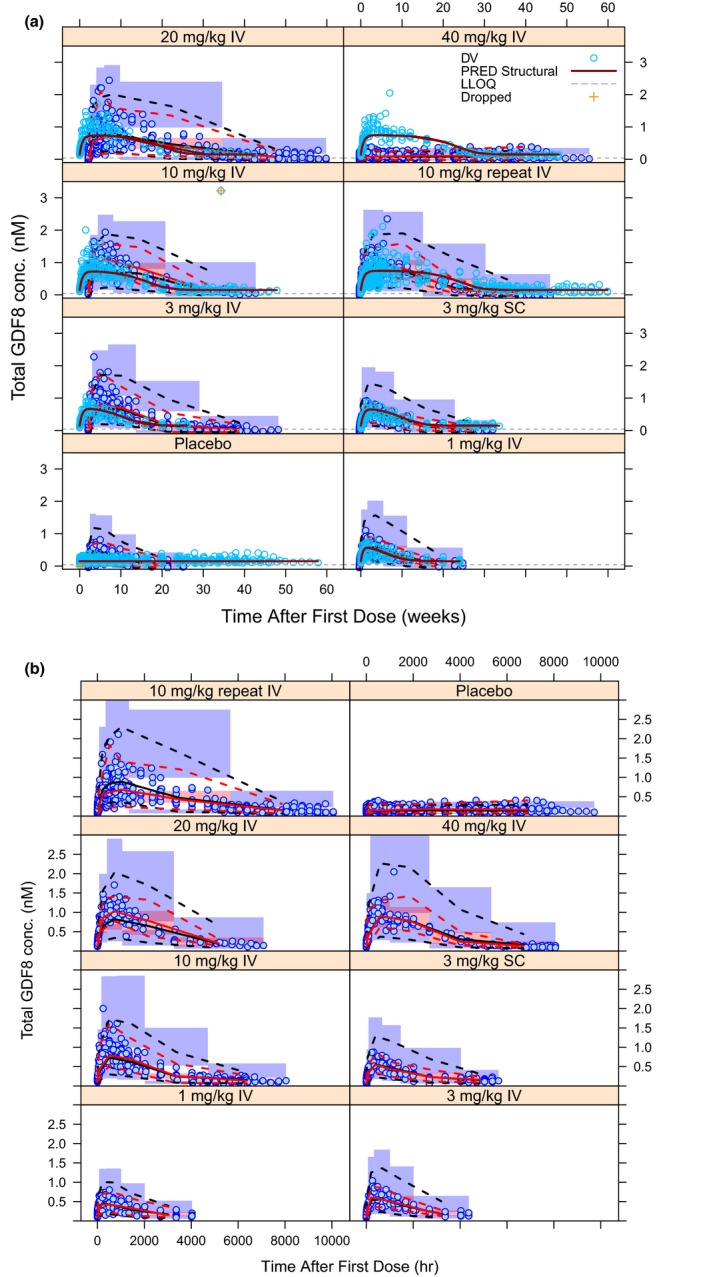
Figure 4.

Visual predictive check for total myostatin concentrations for Michaelis−Menten‐binding kinetic model (a) and Michaelis−Menten‐indirect response 2 model (b). Blue circles are observations. Solid red and black curves represent median of observed data and model predictions. Dashed red and black curves represent 2.5th and 97.5th percentiles of observed data and model predictions. Shaded regions represent the simulation based 95% confidence interval for the corresponding percentiles. GDF8, growth and differentiation factor‐8. PRED, population prediction.
