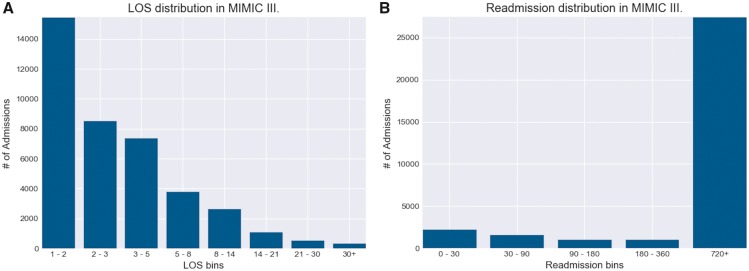
Figure 1.
Distribution of length of stays (LOS) and readmission in MIMIC-III. A, The Distribution of patient volume for each ICU length of stay range. This binning scheme allowed for patient volumes to follow smooth exponential decay with increasing LOS time. Bins 5–8 and 8–14 are of particular interest, as these are frequently used as lower thresholds for defining “LOS outliers” for identifying high-cost admissions. B, The distribution of patient volume for each time-to-readmission range, measured in days. Due to the fact that few patients in MIMIC-III had multiple admissions, the amount of patients that fall under the 720+ days category greatly outnumbers the rest. MIMIC-III, Medical Information Mart for Intensive Care.

