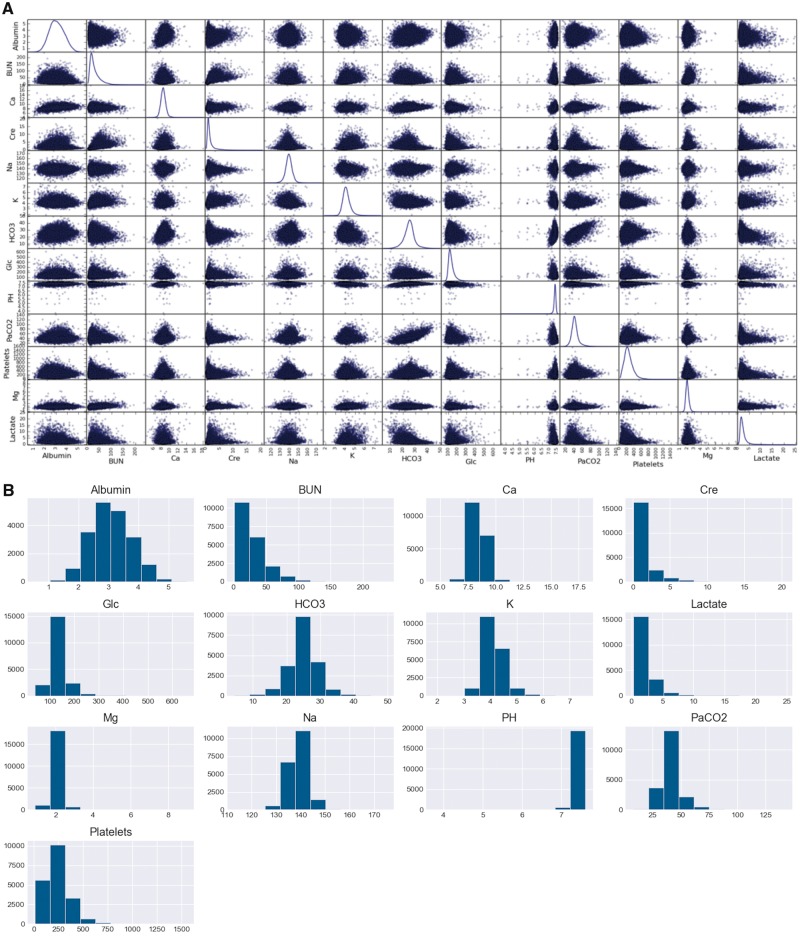
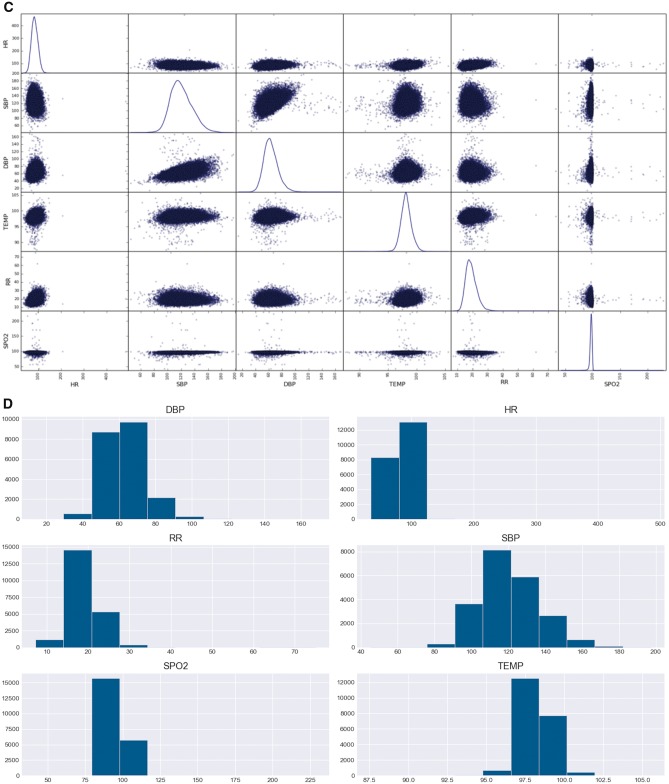
Figure 2.
Distribution of physiologic time-series variables in MIMC-III. A, The kernel density distribution of lab values used in the comparative study. Each variable follows a Gaussian distribution with magnesium and PH having the lowest variance. B, The histogram view of laboratory variable distributions. BUN, creatinine, platelets, and serum lactate measurements demonstrate right-skew behavior while PH is left-skewed.


