
Figure 3.
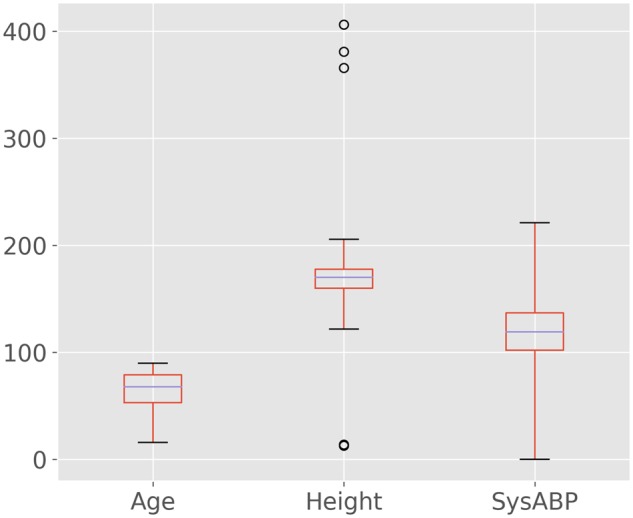
Box-plot of 3 variables with whiskers located at a distance of three times the interquartile range. Points outside these whiskers are labeled “far outliers” and denoted by circles. A test for far outliers with Tukey’s rule raises a warning for height but not age or systolic arterial blood pressure (SysABP).