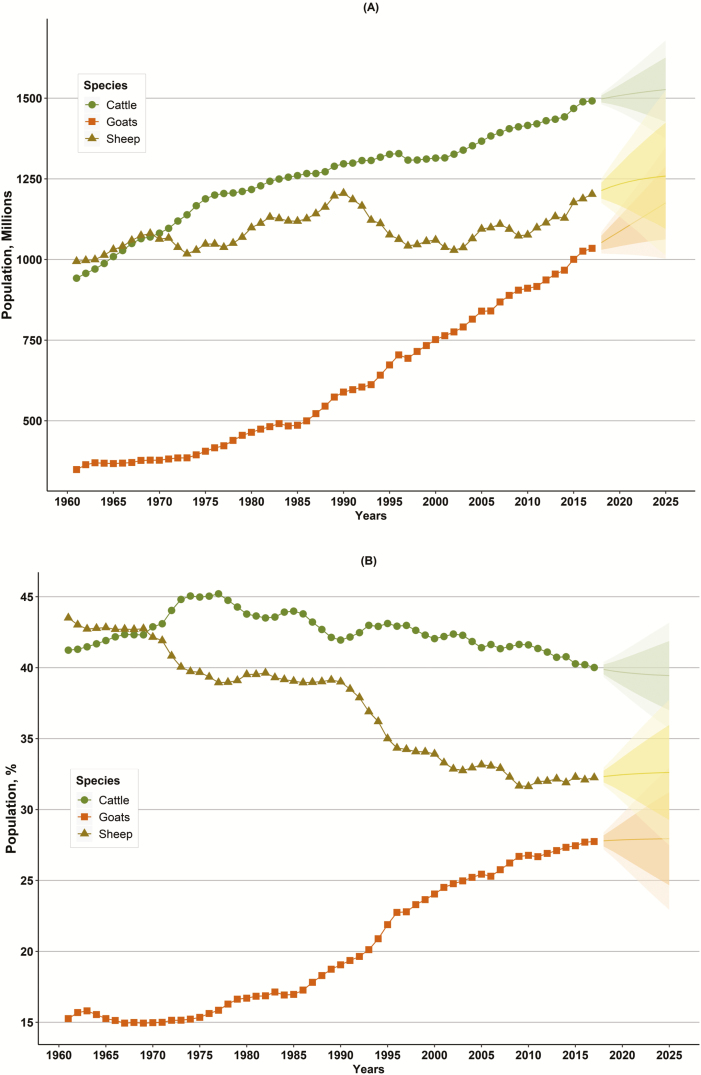
Figure 1.
The world population of cattle (green circles), sheep (orange squares), goats (golden triangles) as head numbers (A) and relative percentage (B) from 1961 to 2017. The solid lines after 2017 represent 8-yr forecasts for each species population, and the shaded areas represent their 80% (darker) and 95% (lighter) prediction intervals. Adapted with permission from Tedeschi and Fox (2018).

