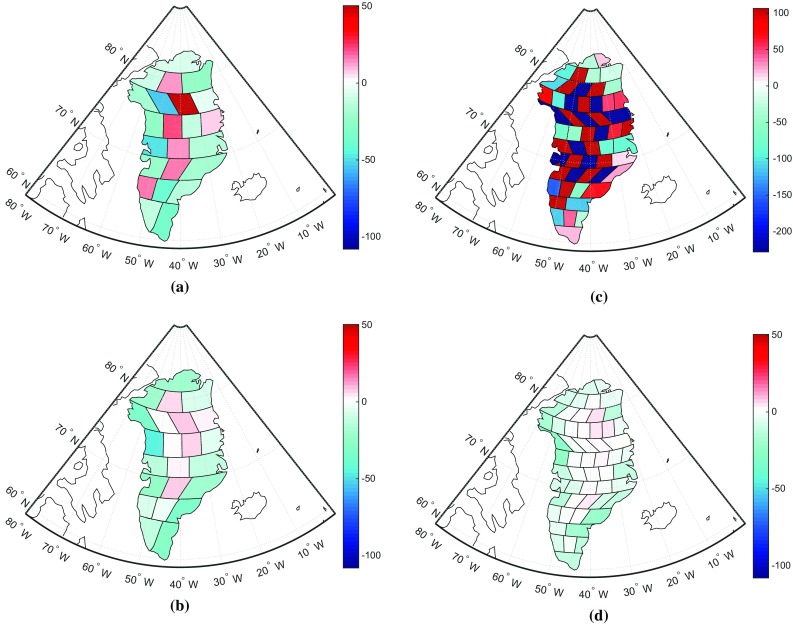
Fig. 11.

a Spatial pattern of recovered mass anomaly per mascon. They are estimated from the data that were contaminated by the errors presented in Figs. 4 and 5 (Gt). b For a better visual comparison, the true signal defined in Fig. 3 is spatially resampled to 23 mascons and shown in the unit of Gt. Similar to (a) and (b), (c) and (d) are for 54 mascons
