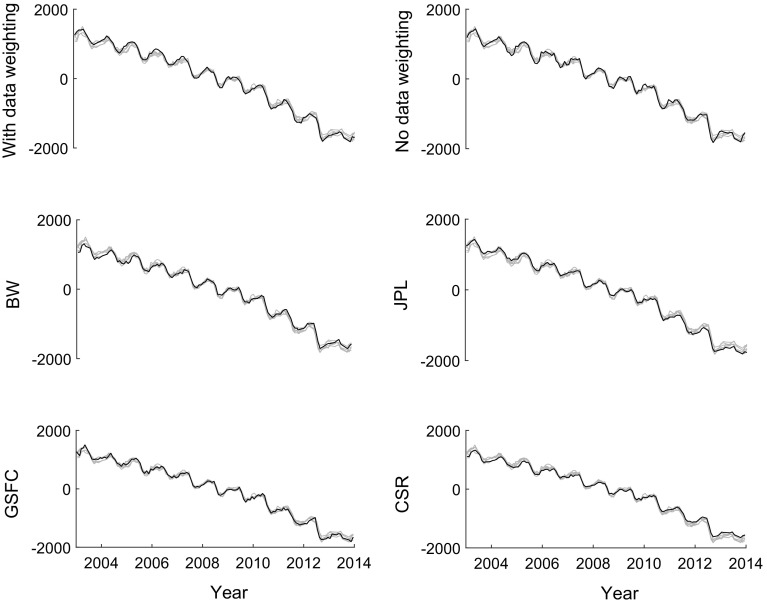
Fig. 17.
Mass anomaly time-series produced in this study with data weighting and without data weighting, as well as by Wouters et al. (2008) (marked as “BW”), JPL, GSFC and CSR. The unit of Y-axis is mass variation in Gts. Each plot highlights only one solution (black line), whereas other solutions are shown in grey

