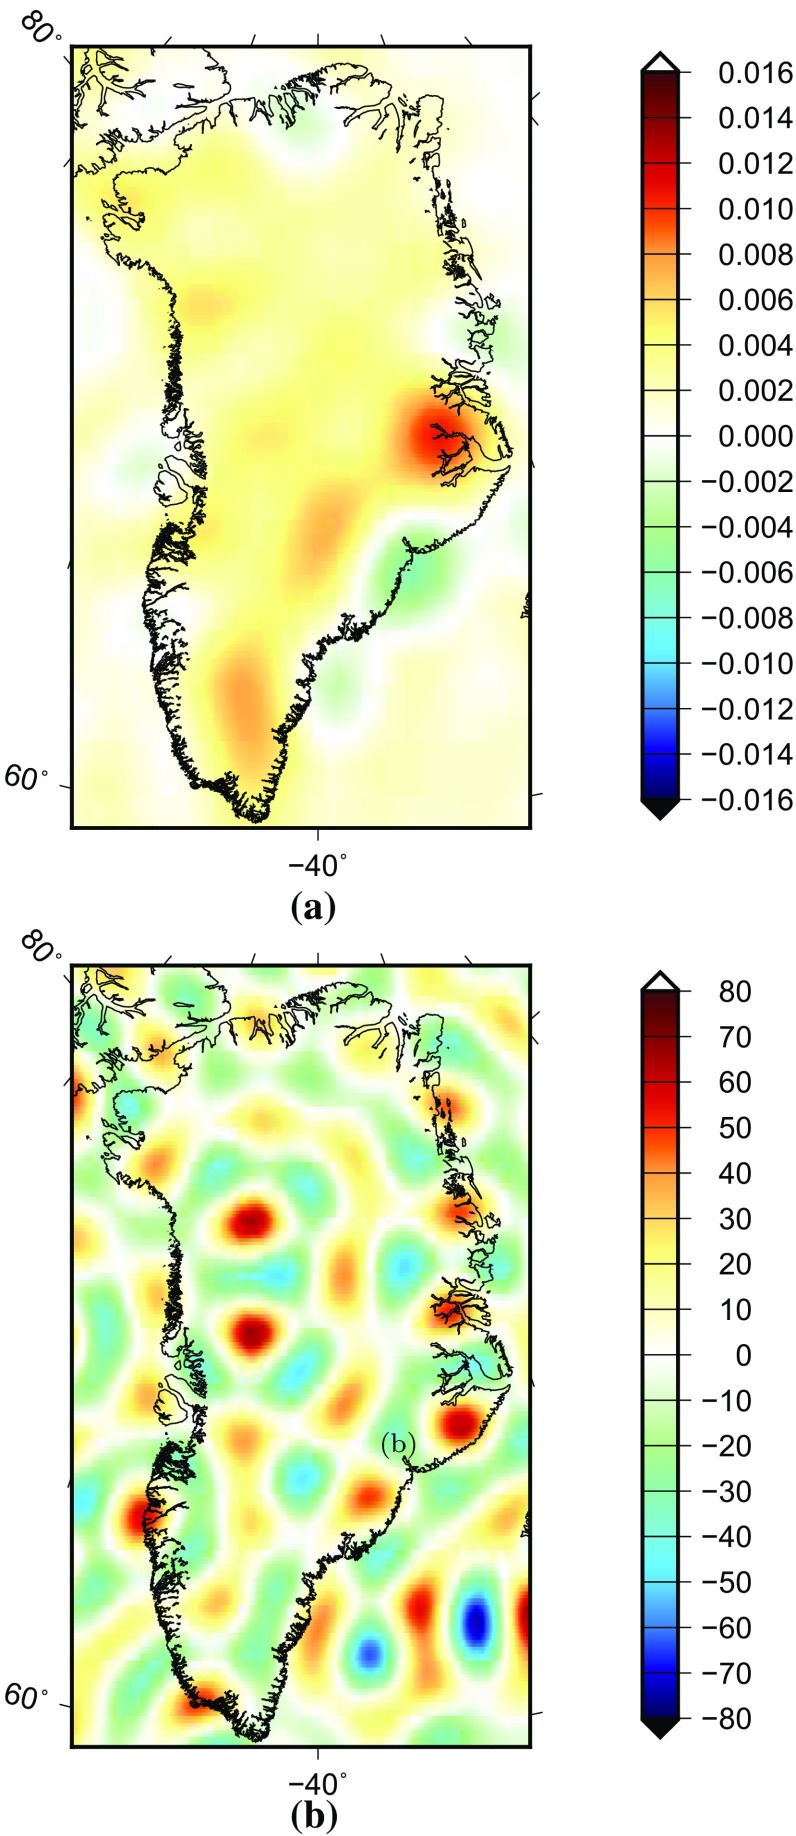
Fig. 5.
The top panel shows the AOD error, which is taken as 10% of the difference between August 2005 and August 2006. The bottom panel is a realization of simulated random errors based on the DMT noise covariance matrix of spherical harmonic coefficients for August 2006. (The matrix is complete up to degree 120.) The units are metres of EWH

