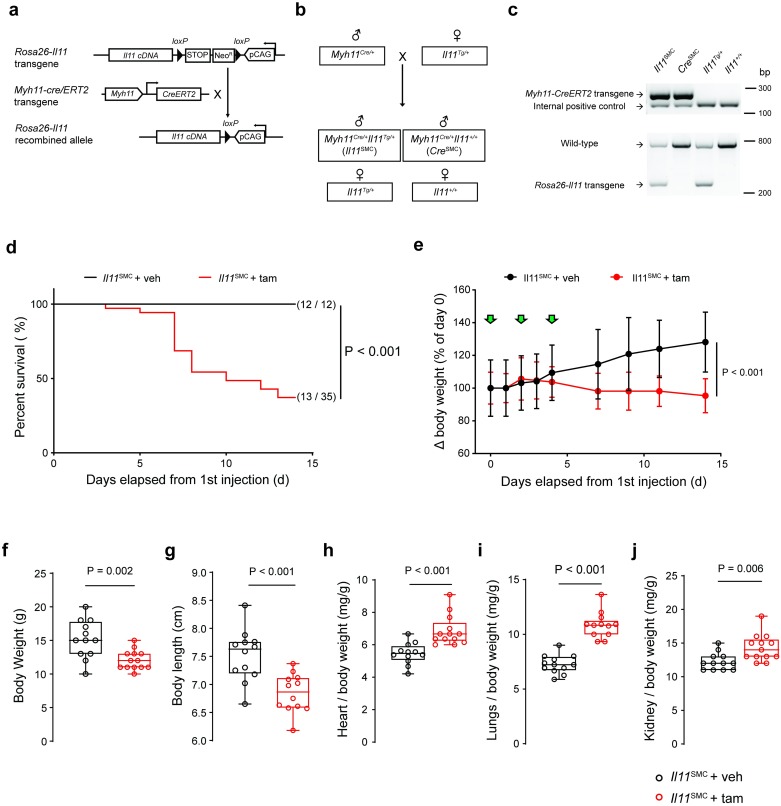
Fig 1. Expression of Il11 in smooth muscle cells is associated with body weight loss, elevated organ weights and spontaneous death.
(a) Schematic diagram of the targeted expression of Il11 in Myh11+ve SMC. In Rosa26-Il11 mice, a floxed cassette containing both the neomycin (neo) resistance and stop elements is positioned before the murine Il11 transgene cassette, which undergoes tamoxifen (tam) initiated Cre-mediated recombination when crossed to the Myh11-Cre/ERT2 mouse. (b) Breeding scheme to generate Myh11Cre/+Rosa26Il11/+ (Il11SMC) and Myh11Cre/+Rosa26+/+ (CreSMC) offspring mice. Note that the Myh11-Cre gene is expressed on the Y chromosome and therefore only male offspring carry the transgene. (c) Genotyping of tail biopsy DNA. A 287 bp band indicates the presence of the Cre transgene whereas the 180 bp band determines the presence of the internal positive control (top gel). Polymerase chain reaction with the Rosa26-Il11 primer set detects a 270 bp band indicative of the Rosa26-Il11 transgene whereas the 727 bp band indicates the presence of the wild-type transgene (bottom gel). Uncropped blots are presented in S2 Fig. (d) Survival curve of Il11SMC mice treated with tam (n = 35) and corn oil vehicle (veh; n = 12) mice following tamoxifen initiation at day 0 and followed until day 14. Survival curves were compared using the log-rank Mantel-Cox test. (e) Body weight changes (expressed as percentage of day 0 body weight) in Il11SMC mice treated with tam or veh (n = 8 per group). Green arrows denote individual injections. Statistical analyses by two-way ANOVA with Sidak multiple comparisons; data expressed as mean ± standard deviation. (f) Collated body weights (left) and (g) body lengths (right) of Il11SMC mice treated with tam or veh measured at d14 post initial tamoxifen dose (n = 12–13 per group). (h) Organ weights of the heart, (i) lung and (j) kidney normalized to body weight in Il11SMC mice treated with tam or veh (n = 12–13 per group). All comparisons were conducted in mice 14 days post-veh and tam treatment. Statistical analyses by two-tailed unpaired t-test; data expressed as median ± IQR, whiskers represent the minimum and maximum values.

