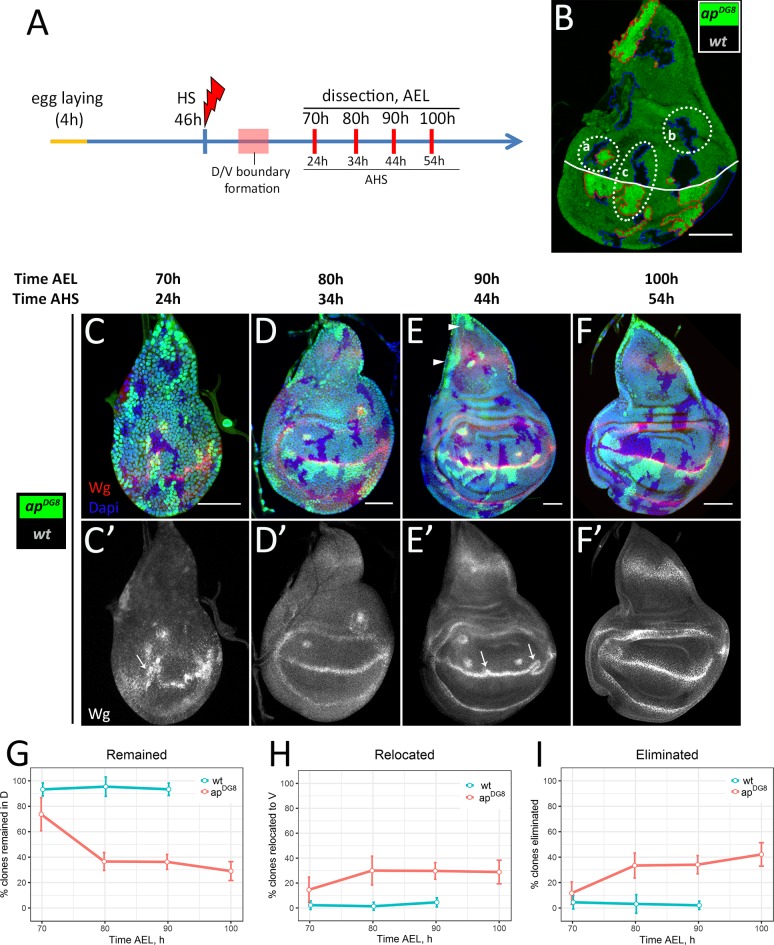
Fig 2. The dynamics of clone elimination.
(A) Time-course scheme. (B) Strategy of clonal analysis. Example of the disc with ap mutant (2 copies of GFP, red outline) and wild-type sister (absence of GFP, blue outline) clones. (a)–wild-type clone together with the mutant twin; (b)–wild-type clone without the mutant sister; (c)–wild-type clone with ap mutant sister in the opposite compartment. White line corresponds to the D/V boundary. (C-F) Wing discs of indicated times containing differently marked wild-type and apDG8 sister clones. (C’-F’) Wg channel of C-F. (G-I) Plots represent amount of dorsal clones that remained in the dorsal part (G), have been relocated to the ventral part (H) or completely eliminated from the disc (I) as a function of time. Number of clones in each group was normalized to the number of dorsally located wild-type clones (per disc). Red lines correspond to the ratios of apDG8 clones to their wt sisters (experimental discs); blue lines correspond to the ratios of wt clones to their wt sisters (control discs, shown on S1 Fig). Note, the control discs were analysed only at 70h, 80h and 90h AEL. A minimum of 15 discs were analysed for each time-point. Data represent mean±CI (95%). Scale bars represent 50μm.

