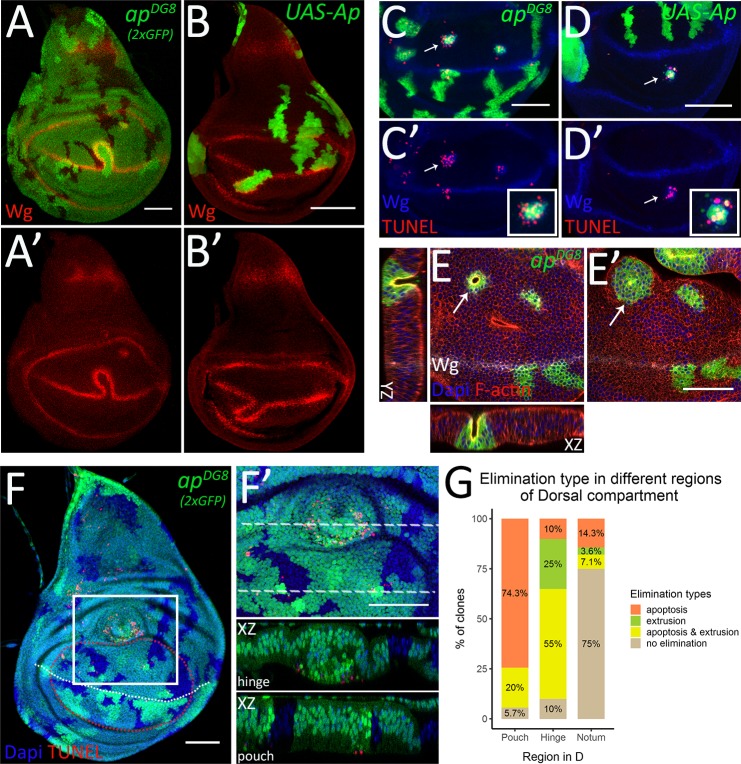
Fig 4. Mechanisms of the elimination display region specificity.
(A-B) Third instar wing discs with apDG8 (A) or Ap-expressing (B) clones displaying D/V boundary deformation and clone relocation. (A’-B’) Wg channel of A-B. (C-D) TUNEL assay of third instar wing discs with apDG8 MARCM (C) or Ap-expressing (D) clones. The pouch regions are shown. (C’-D’) Wg and TUNEL channels of C-D. The insets show enlarged images of single representative clones defined by arrows. (E-E’) Pouch region of the third instar wing disc with apDG8 clones shown from the apical (E) and the basal (E’) sides. The arrows point to the bulging clone. The XZ and YZ planes throughout the bulging clone are also shown (XZ orientation: the apical side–up, YZ orientation: the apical side–right). (F-G) Mechanisms of elimination display region-specificity. (F) Third instar wing disc containing apDG8 mitotic clones (marked by 2 copies of GFP) that remained at 50h AHS. White dashed line represents D/V boundary; red dashed line outlines the pouch region (based on the most proximal fold). (F’) Zoom-in of the region defined by white square in F. The XZ cross-sections throughout the clones located in the hinge and the pouch are shown below (orientation: the apical side–up). (G) Quantification of dorsal mutant clones in different regions depending on the evidence of elimination type: apoptosis, extrusion or apoptosis together with extrusion. A total of 83 dorsal ap mutant clones from 23 discs were analyzed: 35 clones were in the pouch, 20 in the hinge and 28 in the notum. Scale bars represent 50μm.

