. 2020 Jan 8;9:e49998. doi: 10.7554/eLife.49998

Figure 2. Differences between acute monocyte graft -derived macrophages and resident intestinal macrophages.

(A) Volcano plots of genes that change from engrafted macrophages at day 12 and resident macrophages in the colon (left) and ileum (right). Gray dots represent genes that do not significantly change (p-value>0.05), black dots represent genes that significantly change (p-value<0.05). Green and blue squares mark genes with at least 2-fold log fold change (equals 4-fold read change). Numbers inside squares indicate number of genes in square, namely genes that significantly change. Arrows indicate up- or down-regulated genes in resident macrophages compared to engrafted macrophages at day 12 post transfer. (B) Example genes characterizing long-lived intestinal macrophages according to Shaw et al. (C) Example genes highly expressed in resident macrophages compared to engrafted cells. (D) Example genes highly expressed in engrafted cells compared to long-lived macrophages. (E) Example genes participating in IL10/IL10R axis.

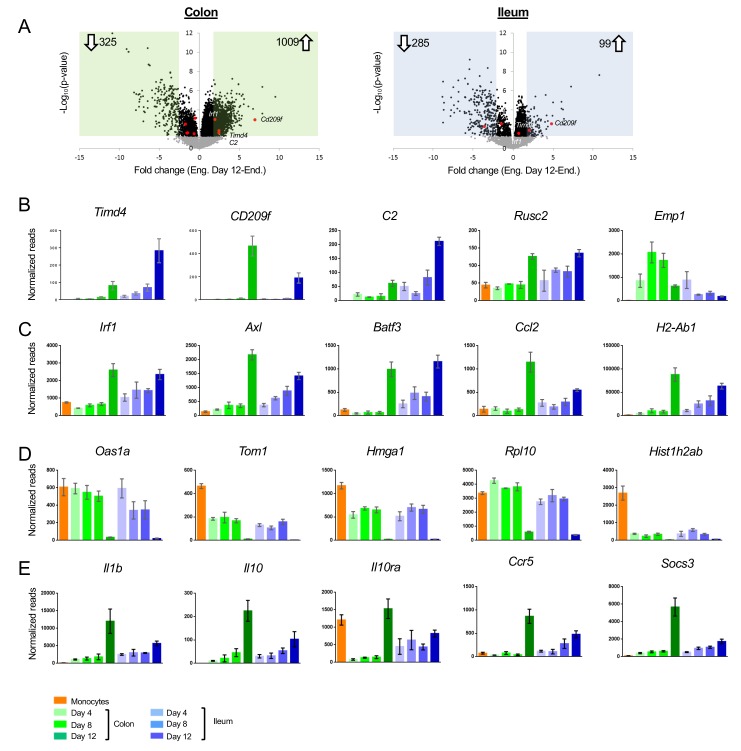
Figure 2.

Figure 2—figure supplement 1. Comparison of graft and engrafted cells to recent monocytic infiltrates in the colon, identified by their Ly6C surface expression.

Figure 2—figure supplement 1.

(A) Representative flow cytometric analysis of colonic myeloid cells. Recent monocytic infiltrates and macrophages in the colon were defined as CD45+ CD11b+ Ly6C+ MHCII- and CD45+ CD11b+CD64+ Ly6C- MHCII+ cells, respectively and sorted accordingly for RNAseq. (B) Representative correlation coefficients between indicated cell populations (Suppl. file 1, data sets 3, 4, 5, 6). (C) Representative genes differentially expressed between monocyte graft, engrafted cells (d4), early monocyte infiltrates and resident macrophages.
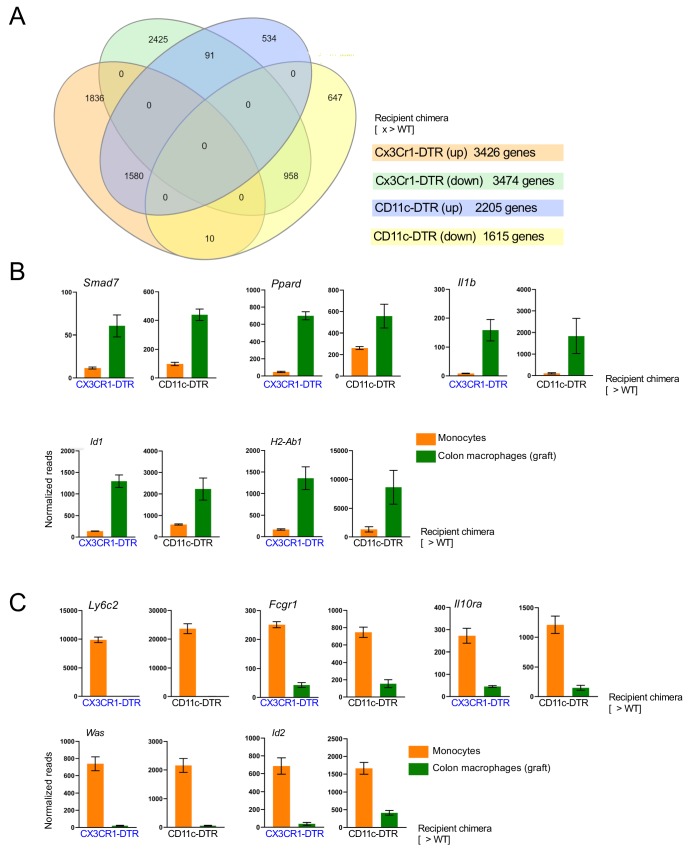
Figure 2—figure supplement 2. Comparison of colonic macrophages generated upon monocyte transfer into [CD11c-DTR > WT] and [CX3CR1-DTR > WT] BM chimeras treated with DTx.

Figure 2—figure supplement 2.

(A) Venn diagrams of gene lists up- and downregulated as compared to the monocyte graft. (B) Representative upregulated genes similarly expressed between the colonic macrophages as compared to the monocyte graft; engrafted cells isolated from [CD11c-DTR > WT] mice (d12); engrafted cells isolated from [CX3CR1-DTR > WT] mice (d14). (C) Representative downregulated genes similarly expressed between the colonic macrophages as compared to the monocyte graft; engrafted cells isolated from [CD11c-DTR > WT] mice (d12); engrafted cells isolated from [CX3CR1-DTR > WT] mice (d14).