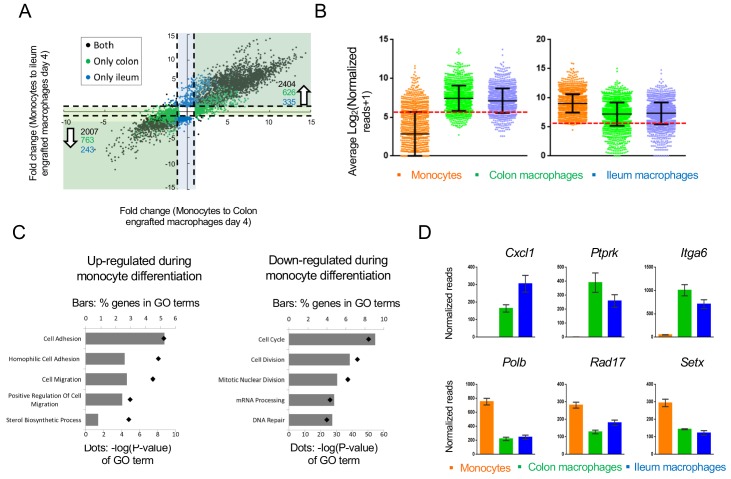
Figure 4. Changes in gene expression during conversion of monocytes into generic intestinal macrophages.
(A) Dot plot for genes whose expression changes at least 2-fold between both monocytes to engrafted colonic macrophages at day four and monocytes to engrafted ileal macrophages at day 4. Black dots: genes that significantly change in the transition to both tissues. Blue dots: genes that significantly change in monocytes to engrafted ileum macrophages only. Green dots: genes that significantly change from monocytes to engrafted colon macrophages only. Only genes that significantly changed from monocytes to both colonic and ileal macrophages at day 4, but expression levels not distinct between colon and ileum at day 4, were selected. (B) Log averages of all genes that are up-regulated (left) or down-regulated (right) in generic intestinal macrophages compared to monocytes. Red line marks threshold (50 reads, 5.672 in log2) of very low/no expression levels. (C) Top 5 GO pathways that are related to genes that are 'selectively expressed in generic intestinal macrophages compared with monocytes (left) or selectively expressed in monocytes compared with macrophages (right). Bars show percent of genes (out of total genes) that are related to each GO term, red markers illustrate the p-value of each GO term. (D) Example genes from GO pathways. Bars indicate mean normalized reads, error bars represent SEM.

