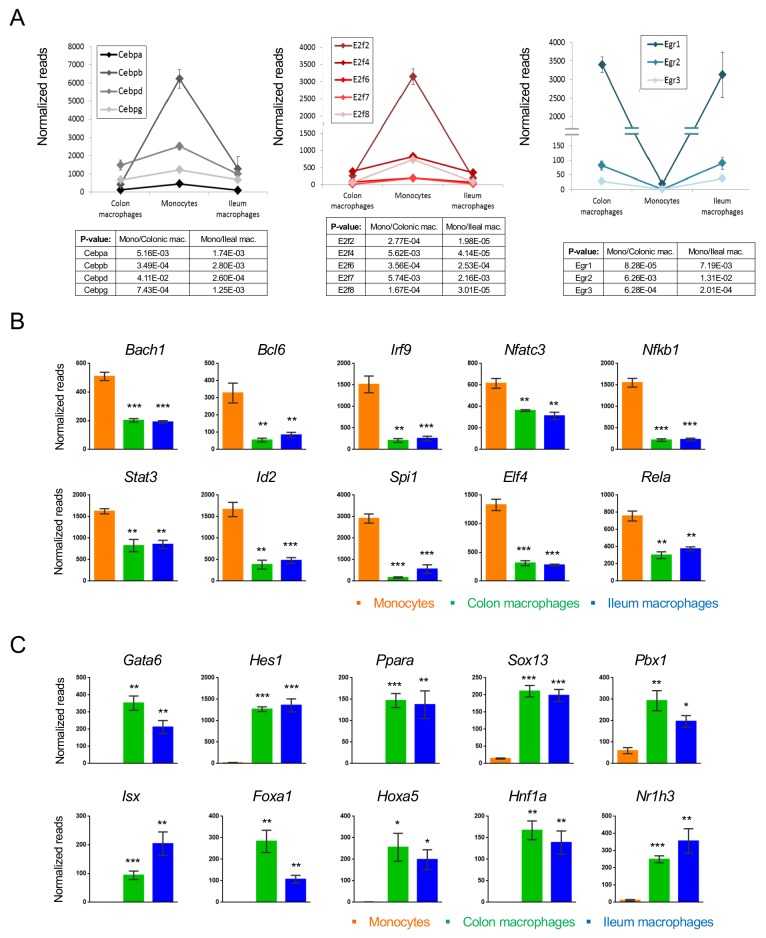
Figure 5. Transcription factors which change during intestinal macrophage differentiation.
(A) Expression graphs of 3 TF families: Cebp (left), E2f (middle) and Egr (right). Lines mark average normalized reads, error bars represent SEM. (B) Representative TFs that are down-regulated in generic intestinal macrophages. (C) Representative TFs that are up-regulated in generic intestinal macrophages.

