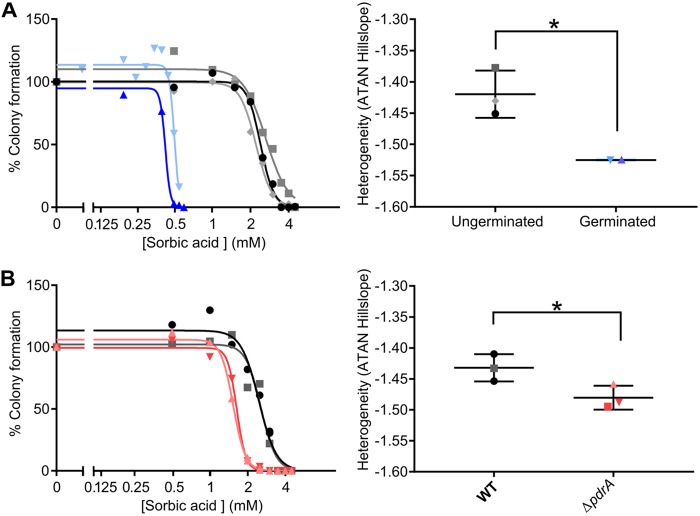
FIG 7.
Sorbic acid dose response curves for A. niger conidia. (A) Dose-response curves of germinated (blue lines) and ungerminated (black/gray lines) WT conidia, and comparison of slope values. Dose-response curve slope values were compared with 2-way Welch’s t test (P = 0.0404,) n = 2 or 3. (B) Dose-response curves of WT (black/gray lines) and ΔpdrA mutant (pink/red lines) conidia and comparison of dose-response curve slope values, compared using a 2-way Welch’s t test (P = 0.0468), n = 3. Two representative independent experiments are shown in the dose-response curve. ATAN, arctangent.

