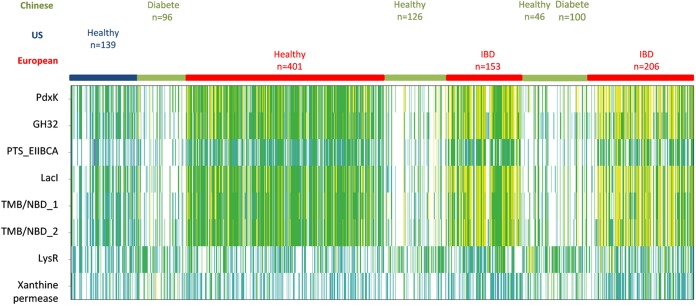
FIG 2.
I9 FOS utilization locus abundance and prevalence in the human gut microbiome. Gene abundance in the fecal metagenome is represented by a color scale: white, not detected; blue, turquoise, green, yellow, orange, and red, increasing abundance with a 10-fold change between colors. Based on its annotation, the xanthine permease-encoding gene is not involved in carbohydrate binding, sensing, transport, or modification.

