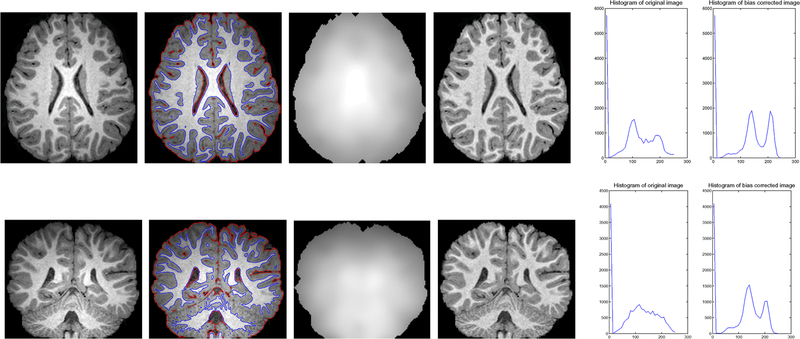
Fig. 7.
Applications of our method to 3T MR images. Column 1: Original image; Column 2: Final zero level contours of ϕ1 (red) and ϕ2 (blue), i.e. the segmentation result; Column 3: Estimated bias fields; Column 4: Bias corrected images; Column 5: Histograms of the original images (left) and bias corrected images (right).

