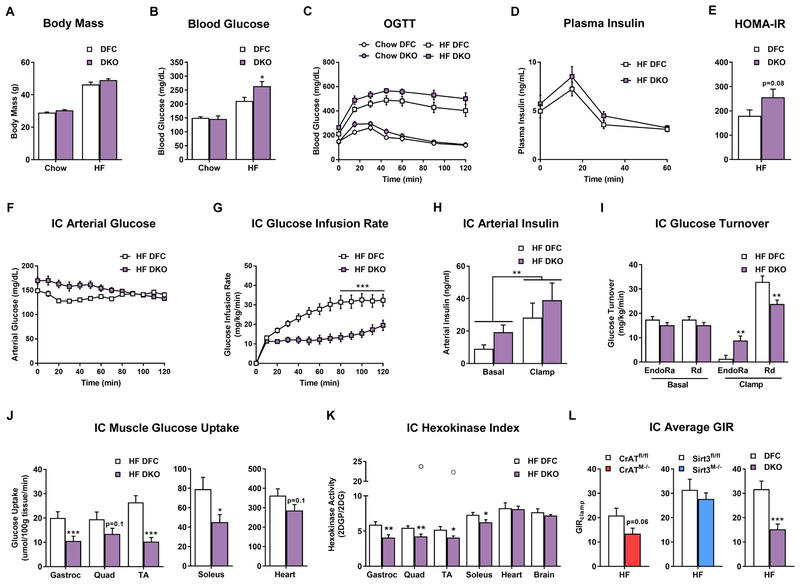
Figure 2. Combined deficiency of CrAT and Sirt3 exacerbates diet-induced perturbations in glucose homeostasis and muscle insulin action.
(A) Body mass prior to oral glucose tolerance test. (B) 5 h fasting blood glucose. (C) Oral glucose tolerance. (D) Plasma insulin during the oral glucose tolerance test. (E) HOMA-IR calculated with values from the 15 min time point. (F) Arterial glucose levels during the insulin clamp (IC). (G) IC glucose infusion rate. (H) Plasma arterial insulin levels during the IC. (I) IC glucose turnover. (J) Muscle glucose uptake during the IC. (K) IC muscle hexokinase index. (L) Average glucose infusion rate (GIR) during the IC steady state for each genotype compared to littermate controls. Data represent mean ±SEM. (A–E) N=7–9 per group. (B) Data were analyzed by two-way ANOVA and * represents a significant difference between HF DFC and HF DKO after Tukey post-hoc testing. (F–K) N=10 per group. (H) Data were analyzed by two-way ANOVA. ** represents a main effect of insulin on arterial insulin levels. (L) N=7–13 per group, data shown in (C–G and I–L) were analyzed by Student’s t-test. *P≤0.05, **P≤0.01, ***P≤0.001. Outliers are represented as open grey circles. N represents biological replicates.

