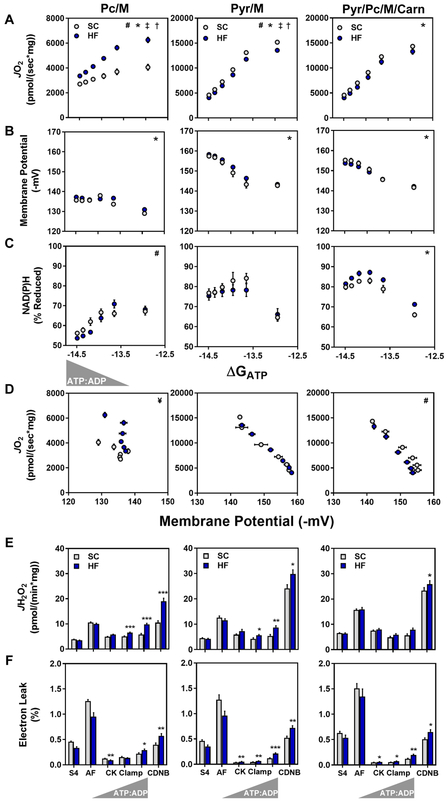
Figure 5. Chronic high fat feeding alters respiratory kinetics and thermodynamics.
Mitochondria were isolated from skeletal muscle of mice fed standard chow (SC) or a 20-week high fat (HF) diet. (A–C) Relationship between (A) JO2, (B) ΔΨ and (C) NAD(P)H/NAD(P)+ redox state versus Gibb’s Energy of ATP hydrolysis (ΔGATP) measured in mitochondria fueled by palmitoylcarnitine+malate (Pc/M), pyruvate+malate (Pyr/M), or Pyr/M+Pc+free carnitine (Carn). (D) Mitochondrial respiratory efficiency represented as JO2 plotted against ΔΨ. (E) Mitochondrial H2O2 emissions (JH2O2). (F) Mitochondrial electron leak, expressed as a percentage of oxygen flux (JH2O2/JO2 x 100 = % Electron Leak). Right triangles represent increasing concentrations of ATP relative to ADP (ATP:ADP) during the CK clamp, resulting in reciprocal changes in energy demand and thus JO2. Data represent mean ± SEM. (A–F) N=6–10 per group. (A–C) Measurements made at submaximal JO2 were analyzed by a two-way ANOVA (* main effect of diet, # diet:ΔGATP interaction, P< 0.05). Maximal JO2 (ΔGATP =−12.95) was analyzed by t-test (‡ P<0.05). (D) Mitochondrial respiratory efficiency was analyzed by ANCOVA using submaximal data to determine whether slopes and intercepts differed as a result of diet (# diet:ΔΨ interaction, P< 0.05, and ¥ indicates these data could not be fit via linear regression). Data in (E and F) were analyzed by Student’s t-test *P≤0.05, **P≤0.01, ***P≤0.001. N represents biological replicates.

