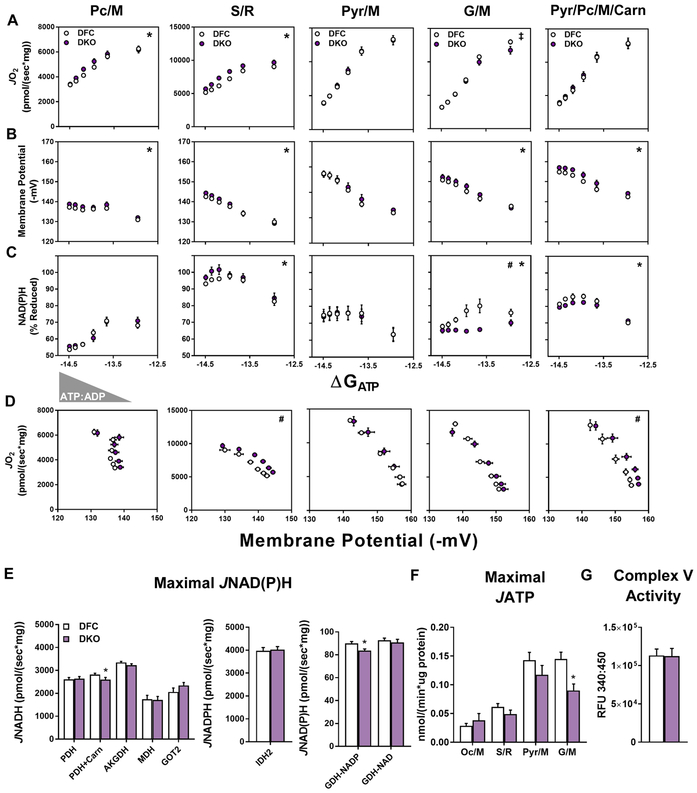
Figure 6. The DKO model reveals a paradoxical disconnect between mitochondrial Kac and respiratory dysfunction.
Mitochondria were isolated from skeletal muscles of DFC and DKO mice fed a high fat (HF) diet. (A–C) Relationship between (A) JO2, (B) ΔΨ and (C) NAD(P)H/NAD(P)+ redox state versus Gibb’s Energy of ATP hydrolysis (ΔGATP) measured in mitochondria fueled by palmitoylcarnitine+malate (Pc/M), succinate/rotenone (S/R), pyruvate+malate (Pyr/M), glutamate+malate (G/M), or Pyr/M+Pc+free carnitine (Carn). (D) Mitochondrial respiratory efficiency represented as JO2 plotted against ΔΨ. (E) Rates of maximal mitochondrial dehydrogenase enzyme flux shown as NADH or NADPH production (JNADH or JNADPH) measured in alamethecin permeabilized mitochondria. (F) Maximal ATP efflux (JATP) in intact mitochondria fueled by octanoylcarnitine+malate (Oc/M), S/R, Pyr/M, or G/M. (G) Complex V activity in mitochondrial lysates. Right triangles represent increasing concentrations of ATP relative to ADP (ATP:ADP) during the CK clamp, resulting in reciprocal changes in energy demand and thus JO2. Data represent mean ± SEM. (A–F) N=5–10 per group. (A–C) Measurements made at submaximal JO2 were analyzed by a two-way ANOVA (* main effect of genotype, # genotype:ΔGATP interaction, P< 0.05). Maximal JO2 (ΔGATP =−12.95) was analyzed by T-test (‡ P<0.05). (D) Mitochondrial respiratory efficiency was analyzed by ANCOVA using submaximal data to determine whether slopes and intercepts differed as a result of diet (# diet:ΔΨ interaction, P< 0.05). Data in (E–G) were analyzed by Student’s t-test *P≤0.05, **P≤0.01, ***P≤0.001. N represents biological replicates.

