Fig. 3.

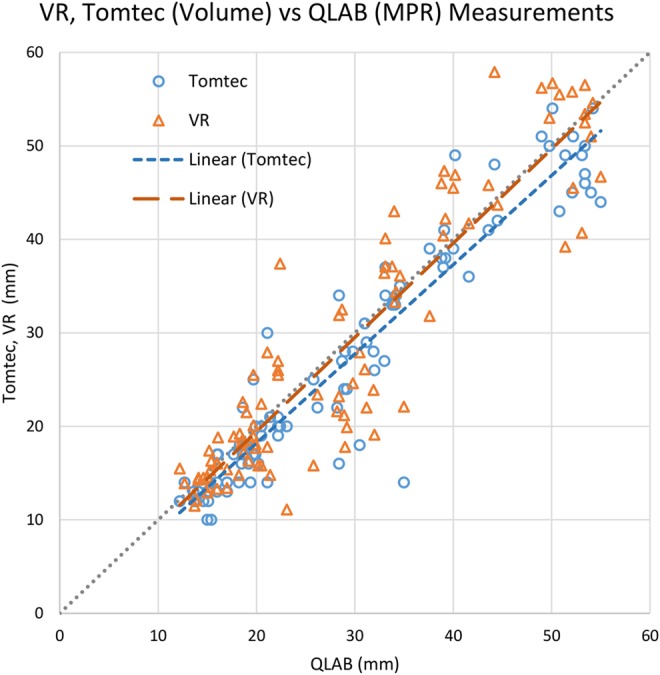
Comparison of VR and Tomtec volume measurements referred to QLAB's MPR measurements, carried out on patient data. Markers represent individual measurements, and the dashed lines indicate linear regressions of the data points

Comparison of VR and Tomtec volume measurements referred to QLAB's MPR measurements, carried out on patient data. Markers represent individual measurements, and the dashed lines indicate linear regressions of the data points