Fig. 5.

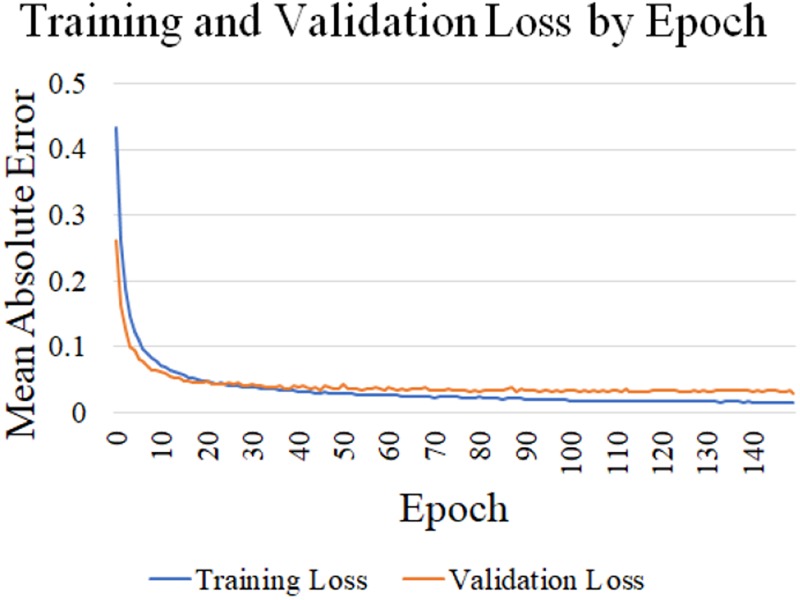
Graph displaying the change in training and validation loss (MAE) throughout the training process. The loss is calculated in terms of the output of the neural network, which is an (x, y) coordinate pair with values in [−1, 1]

Graph displaying the change in training and validation loss (MAE) throughout the training process. The loss is calculated in terms of the output of the neural network, which is an (x, y) coordinate pair with values in [−1, 1]