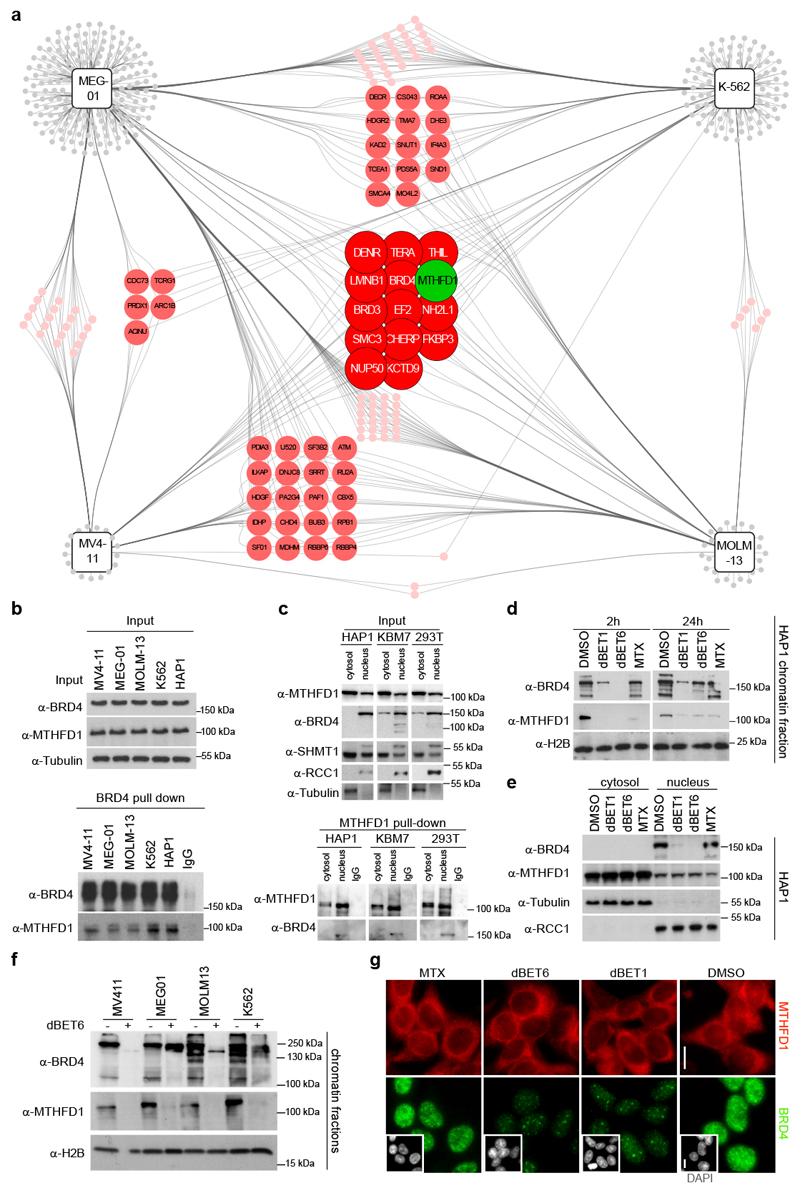
Figure 2. BRD4 recruits MTHFD1 to chromatin.
a, BRD4 interactomes in MEG-01, K-562, MV4-11and MOLM-13 cell lines. Proteins are represented as circles, colors indicate the number of cell lines in which a particular interacting protein was detected. b, Western blot confirmation of the BRD4-MTHFD1 interaction in leukemia cell lines. The experiment was repeated twice with similar results. c, Upper panel: Western blot following nuclear vs cytoplasmic fractionation in HAP1, KBM7 and HEK293T cell lines. RCC1 was used as nuclear loading control while tubulin was used as cytosolic loading control. Lower panel: Western blot following MTHFD1 pull-down in the different cell fractions. The experiment was repeated three times with similar results. d, Western blot performed on chromatin-associated protein samples extracted from HAP1 cells treated with the indicated compounds for 2 h (dBET1: 0.5 μM; dBET6: 0.5 μM; MTX: 1 μM) or 24 h (dBET1: 0.5 μM; dBET6: 0.05 μM; MTX: 1 μM). H2B was used as loading control. The experiment was repeated three times with similar results. e, Western blot for nuclear vs cytoplasmic protein levels in HAP1 cells treated for 24 h as above. The experiment was repeated twice with similar results. f, Western blot from chromatin fractions of MEG-01, K-562, MV4-11 and MOLM-13 cells treated with dBET6 for 2 h. The experiment was repeated twice with similar results. g, Immunofluorescence images of HeLa cells treated with the indicated compounds and stained for MTHFD1, BRD4, and DAPI (small inserts). Scale bar 10 μm.

