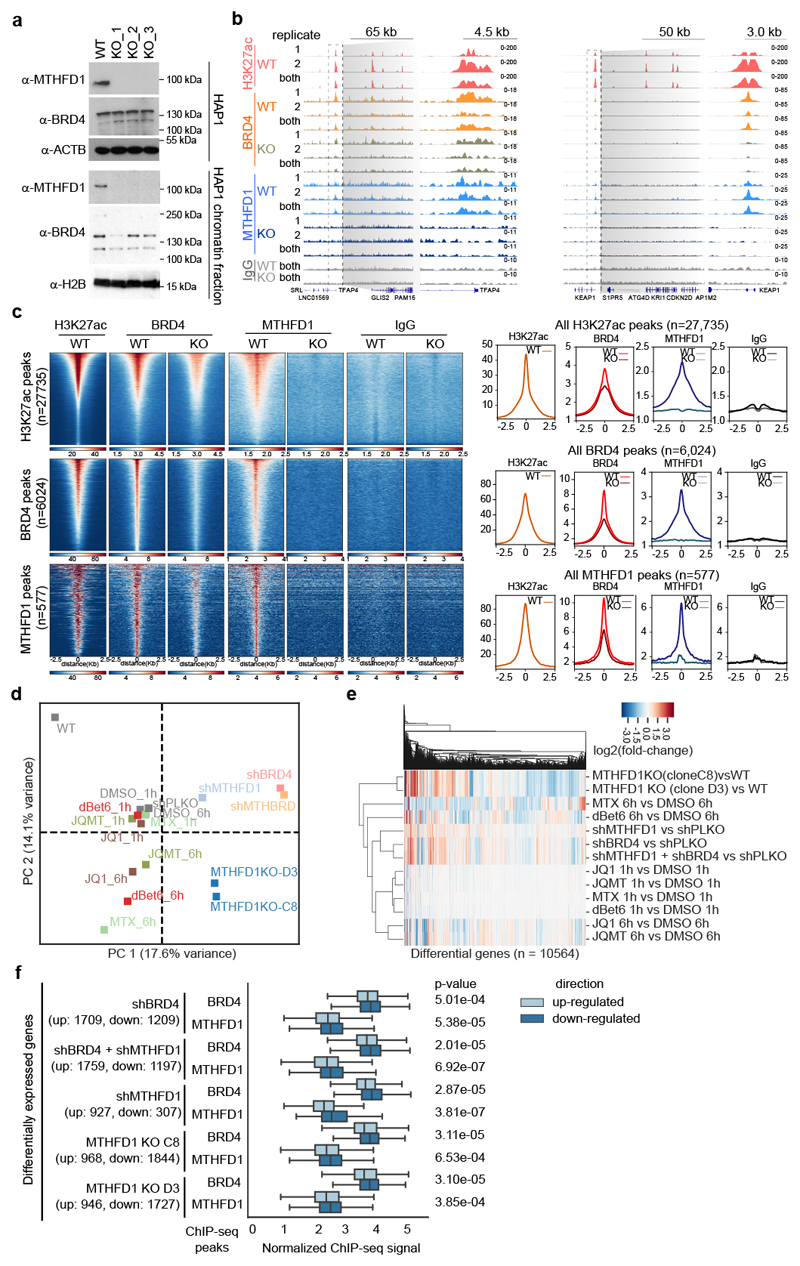
Figure 3. MTHFD1 regulates transcription by binding BRD4-occupied chromatin.
a, Validation of MTHFD1 knock-out HAP1 cell lines. The experiment was repeated three times with similar results. b, Representative genome browser view of BRD4, MTHFD1, and H3K27ac binding in the promoters of TFAP4 (left) and KEAP1 (right). All ChIP tracks were normalized to 1X genome coverage. All the IPs were performed in biological duplicate. Specifically for MTHFD1 knock-out cells, MTHFD1 KO_1 and MTHFD1 KO_3 were used as independent biological replicates. c, Enrichment of BRD4 and MTHFD1 ChIP signal. Peaks were sorted by total abundance and data represent merged replicates normalized to 1× coverage. d, Principal component analysis of RNA-seq data of two MTHFD1 knock-out clones and of WT HAP1 cells treated with 0.1 μM dBET6, 1 μM (S)-JQ1, 1 μM MTX, shRNAs targeting BRD4 or MTHFD1. Equal amount of DMSO, or non-targeting hairpins were used as respective control conditions and two biological replicates were performed for each experimental condition. e, Heatmap of relative transcription changes in HAP1 cells compared to respective control cells. f, Integration of ChIP-seq and RNA-seq data in HAP1 cells. BRD4 and MTHFD1 binding at sites associated with genes which are significantly up- or down-regulated upon knockdown of BRD4 and/or MTHFD1 and in MTHFD1 knock-out cells compared to HAP1 WT cells. Values represent estimated factor abundance normalized by matched IgG signal and equality of distributions was assessed with with a one-sided Mann–Whitney U test. Boxplot boxes represent interquartile range with center on median, and whiskers represent values 1.5× outside the respective interquartile range.

