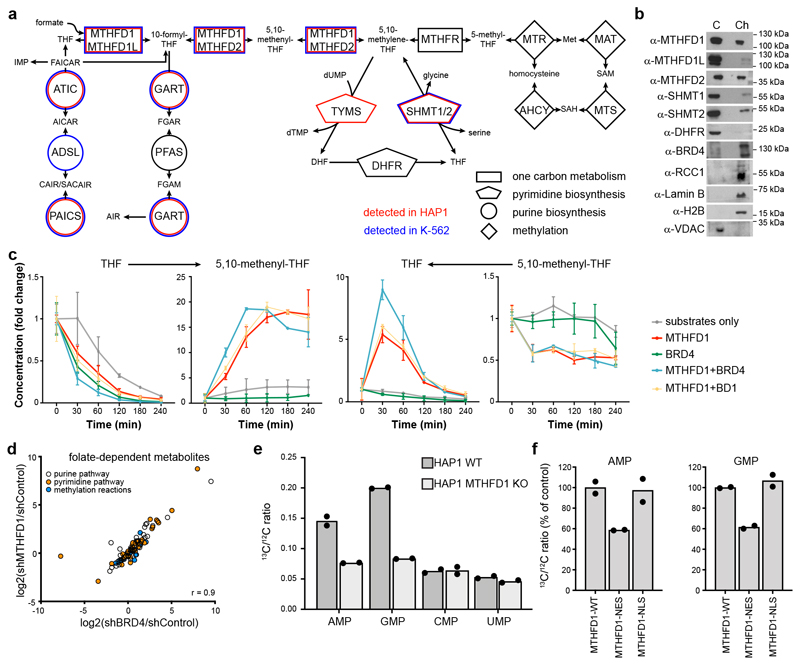
Figure 4. Effects of MTHFD1 loss on nuclear metabolite composition.
a, Representation of the folate pathway. Enzyme names are reported inside the geometric shapes, connecting the different metabolites. Enzymes that were found associated with chromatin in HAP1 and K-562 cells by mass spectrometry analysis are indicated in red and blue, respectively. Two biological replicates were done. b, Western blot for folate pathway enzymes in the cytoplasmic (C) and chromatin (Ch) fractions of HAP1 cells. The experiment was repeated twice with similar results. c, Recombinant enzyme assays for MTHFD1 activity to convert THF and formate to 5,10-methenyl-THF and vice versa in the presence or absence of full-length BRD4 or its first bromodomain. Mean ± SD from n = 2 independent samples. d, Scatter plot representing metabolite changes in the pyrimidine, purine and methionine biosynthetic pathways upon downregulation of BRD4 or MTHFD1 by shRNA. Two biological replicates were done for each experimental condition. r-value indicates the Pearson correlation coefficient. e, Incorporation of labeled formate into RNA. HAP1 WT and MTHFD1 knock-out cells were treated with 13C-labeled formate for 24 h, followed by RNA extraction and LC-MS-MS analysis of nucleotides for the 13C/12C ratio. Two biological replicates were performed for each experimental condition. f, Incorporation of labeled formate into RNA using the same procedure with MTHFD1 knock-out cells transiently transfected with full-length MTHFD1, or the protein with either a nuclear localization signal (NLS) or a nuclear export signal (NES). Percent of control is calculated considering the 13C incorporation in HAP1 WT and MTHFD1 knock-out respectively as 100% and 0. Two biological replicates were performed for each experimental condition.

