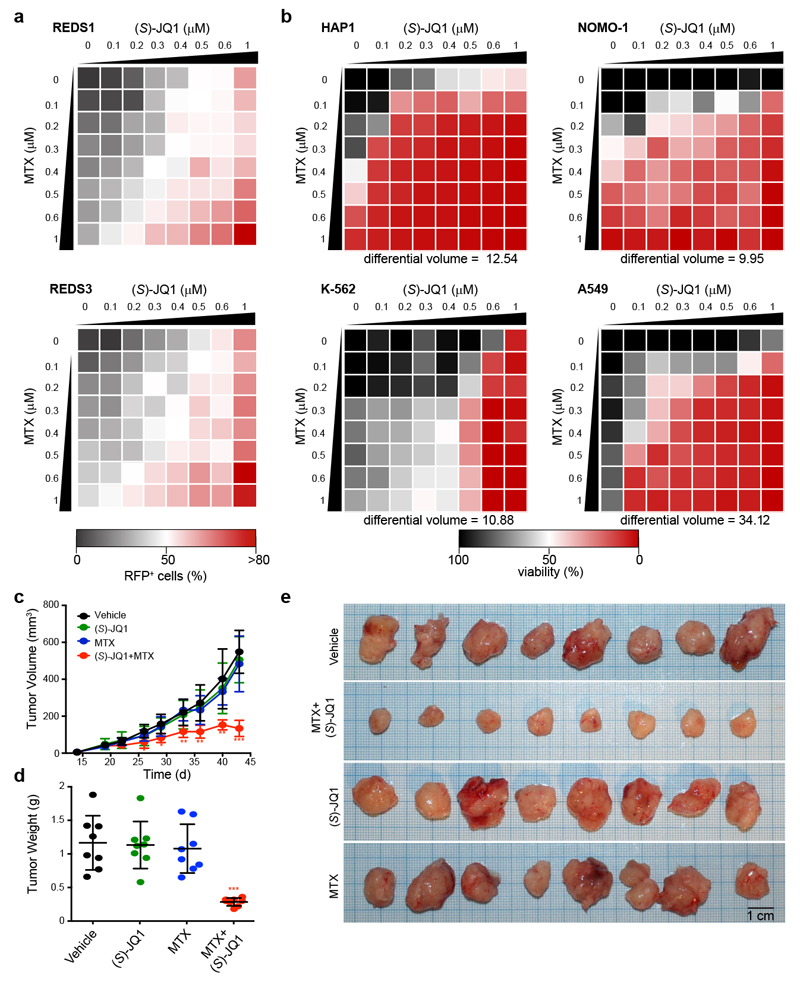
Figure 5. BET bromodomain inhibitors synergize with antifolates to impair cancer cell growth.
a, Dose response matrix displaying REDS1 and REDS3 RFP-positive cells treated with the indicated concentrations of (S)-JQ1 and MTX alone or in combination. Means from two biological replicates. b, Dose response matrices displaying cell viability of HAP1, NOMO-1, K-562 and A549 treated for 72 h with (S)-JQ1 and MTX alone or in combination. Means from two biological replicates. Differential volume indicates the sum of all deviations from Bliss additivity over the dose response matrix. c, Tumor volumes from a A549 xenograft mouse model treated five times per week with 30 mg/kg (S)-JQ1 and/or twice weekly with 25 mg/kg MTX from day 19. Means and standard deviations from eight mice per group. Asterisks indicate significance of 1-way ANOVA adjusted by Tukey’s multiple comparison test (* P < 0.05; ** P < 0.005; *** P < 0.0001) d, Weight and of tumors at the end of the experiment (day 43). Means and standard deviations from eight mice per group. Asterisks indicate significance of 1-way ANOVA adjusted by Tukey’s multiple comparison test (P = 0.00000050). e, Images of tumors at the end of the experiment (day 43).

