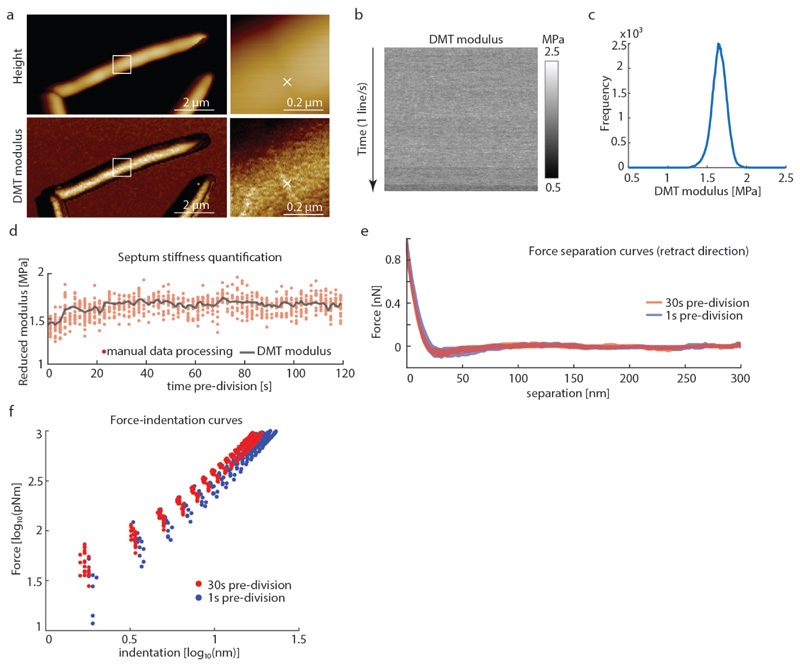
Extended Data Figure S7. Comparison of stiffness values obtained from QNM DMT modulus imaging channel and analysis of the individual force-distance curves.
To compare the stiffness given by the DMT modulus imaging channel with manual analysis of the recorded force curves, force curves were recorded leading up to a cell cleavage event using QNM mode in peak force capture to record the individual force-distance curves at a ramp rate of 1 kHz and a peak force of 1 nN. (a) The cantilever tip was positioned at the center of a PCF (white cross ‘x’). (b) Force-distance curves were recorded at the same spot on top of the PCF without laterally moving the tip. (c) The mean value obtained from the DMT modlus channel was ~1.6 MPa. (d) For each line in the DMT modulus image (corresponding to 128 data points in 0.5 seconds) the average stiffness value was calculated and plotted (black line). Every tenth force curve was then processed manually with Nanoscope Analysis software. Each retract direction of the force curve was corrected to set the baseline to 0 nN, then a moving average filter with a width of 5 units was applied. To extract mechanical property values, a Hertzian fit was used in the range between 4% to 98% of the maximal force (red dots), then 50% of the force curves with the highest r2 values were plotted. The DMT modulus values extracted from the QNM channel image are in good agreement with manual force-distance analysis. Decrease in stiffness at the septum during the last phase of cell division was observed in the DMT modulus channel and the force curve analysis alike (last ~20 seconds). (e) Representative force-separation curves taken at either 30 seconds (red) or 1 second (blue) before cell cleavage. (f) To unveil multiple slopes that could potentially derive from different cell wall layers, the same data as in (e) were used to plot the slope of the force-separation curves in a log-log plot as has been done by others 2 to discriminate between the contribution of the cell wall and the turgor pressure. However, in these measurements there is no clear distinction that would account for two different linear slopes. The decrease in the stiffness at 1 second (blue) before cleavage compared to the stiffness at 30 seconds (red) before cleavage is clearly discernible in the log-log plot.

