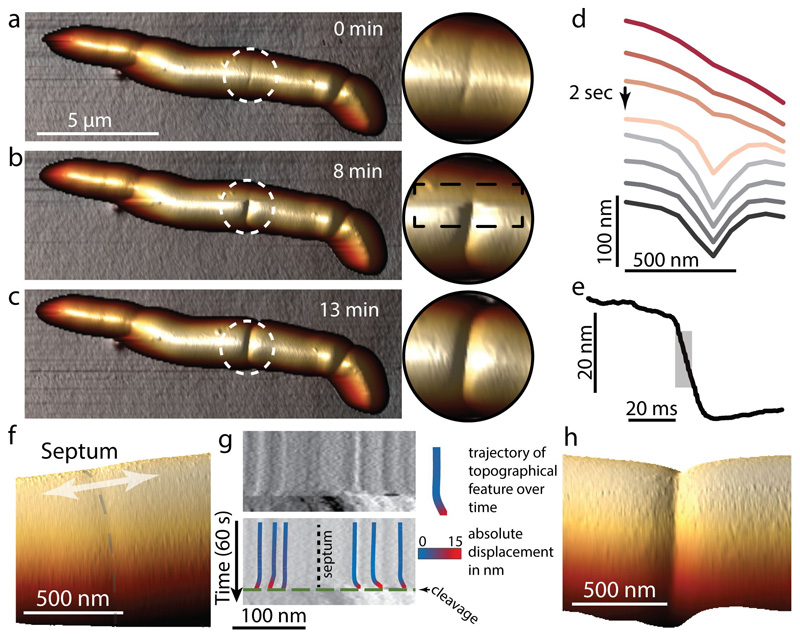
Figure 2. Daughter cell cleavage occurs with millisecond kinetics by rupture around the PCF.
(a-c) Consecutive 3D rendered AFM images of cleavage (b) and zoom-ins of the cleavage site. The AFM slow-axis scan direction in (b) is from top to bottom, revealing the transition from the PCF to cleavage. (d) Line sections through the AFM height data around the PCF during cleavage. In the example shown, the PCF progressed to the cleaved state within one scan line (2 seconds, arrow). (e) Constant point measurement of the height at the PCF with a repetition rate of 1 kHz reveals an abrupt drop in height, with 50% of the total decrease (grey area) occurring within 7 milliseconds. In all, similar rapid divisions have been observed >22 times. (f-h) Tracking topographical features (fiducial markers) on either side of the septum prior to cell cleavage reveals material stretching. (f) Zoom-in on center part of a cell with a septum (grey dashed line) prior to cell cleavage. (g) Kymograph of a continuous scan (1 line per second) over time perpendicular across the septum (arrow in (f)) revealing nanometer-sized movement of nanoscale structures on the cell surface (top). Immediately prior to cleavage (green dashed line (bottom)), the material stretches and surface features move apart in opposite directions on either side of the septum (black dotted line). Color-coding of the trajectory of surface features indicates the total lateral displacement away from the septum. (h) 3D height representation of a representative newly cleaved cell (same area as in (f)). See also Extended data Figure S5.

