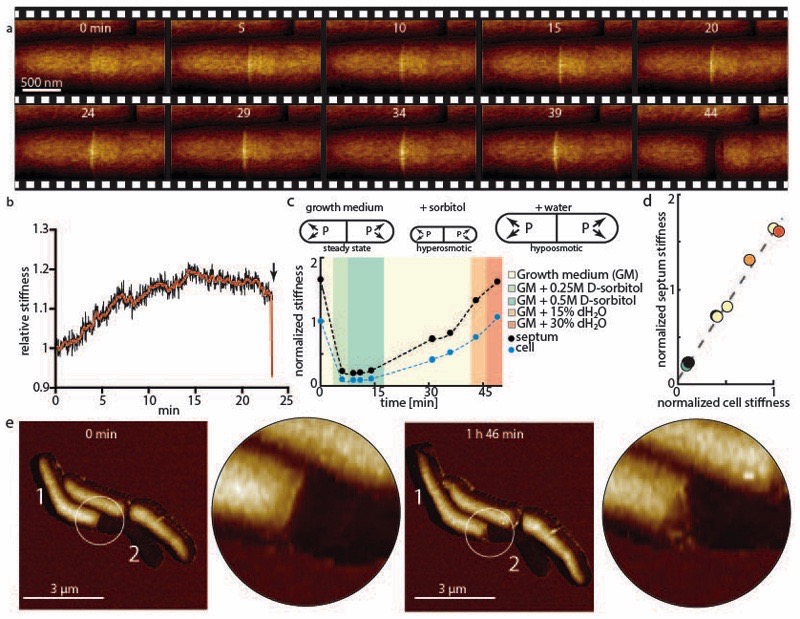
Figure 3. Turgor pressure drives cell cleavage through stress concentration at the PCF.
(a) Time sequence of measured stiffness map of the cell surface from appearance of the PCF until cleavage (n=22). (b) Changes in the local stiffness at the PCF leading up to cell cleavage (x-axis, time in minutes; y-axis, PCF stiffness normalized to bulk stiffness of cell sidewalls). After an initial gradual increase of the stiffness at the septum, a small decrease occurs before cleavage (red line, average over 20 data points). (c) Measurement of apparent stiffness on top of the septum (black lines) and on top of the cell bodies (blue lines, average of the two nascent sibling cells) as turgor pressure is modulated by hyper-osmotic (green shading) and hypo-osmotic (orange shading) media. Measured stiffness on the PCF and cell bodies is affected by the turgor pressure to a different extent. Measured stiffness values on the cell and on the PCF are normalized to initial stiffness of the cell in normal growth medium. (d) When varying medium osmolarity, the measured PCF stiffness is linearly dependent with the measured cell stiffness with a slope of ~1.5 (r2=0.991), suggesting a stress concentration of 50% on the PCF. Measured stiffness values on the cell and on the septum are normalized to the initial stiffness of the cell in normal growth medium. (e) If one nascent sibling cell is deflated after cytokinesis but before cleavage (0 minutes), rapid cleavage is replaced by gradual shedding of the deflated sibling cell, indicating that rapid cleavage requires turgor pressure in both sibling cells.

