
Figure 5.
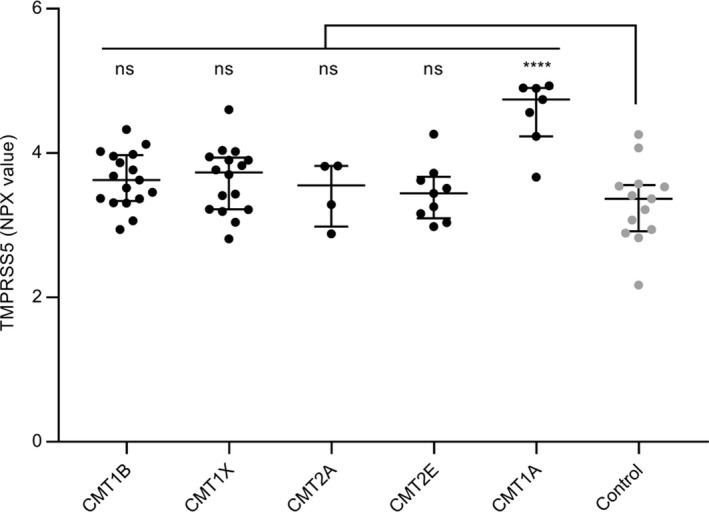
Evaluation of TMPRSS5 in plasma samples from different CMT subtypes. TMPRSS5 levels in plasma samples from CMT1B (n = 17), CMT1X (n = 16), CMT2A (n = 4), CMT2E (n = 9), CMT1A (n = 7) compared to control (n = 13) shown as NPX with median and IQR. FC and P (Abnova comparison of groups followed by Dunnett’s multiple comparison test) for comparison with controls were CMT1B 1.26 P 0.1876, CMT1X 1.26 P 0.2003, CMT2A 1.11 P 0.9647, CMT2E 1.11 P 0.9156, CMT1A 2.40 P 0.0001. Statistically significant elevation to the control cohort is indicated ****P 0.0001, not significant (ns) >0.20.