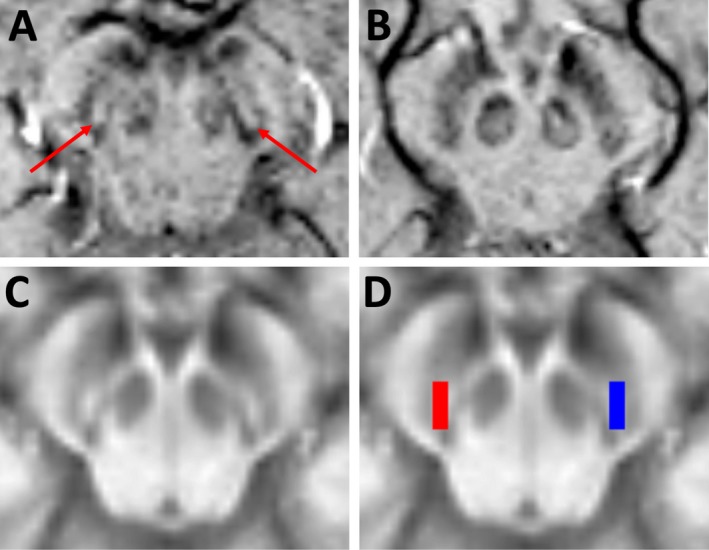
Figure 1.

(A and B) Example SWI images at the level of the substantia nigra from a control participant (A) and a patient with Parkinson’s disease (B). The dorsal nigral hyperintensity can be seen in the control participant (red arrows), but is absent in the patient with Parkinson’s disease. (C and D) images used in quantification of the DNH signal. (C) A template image showing the average normalized SWI intensity across 32 healthy control subjects. (D) regions of interest from the left (blue) and right (red) DNH were used to calculate the mean DNH signal intensity in each participant. Abbreviations: SWI, susceptibility‐weighted imaging; DNH, dorsal nigral hyperintensity.
