Fig. 1.

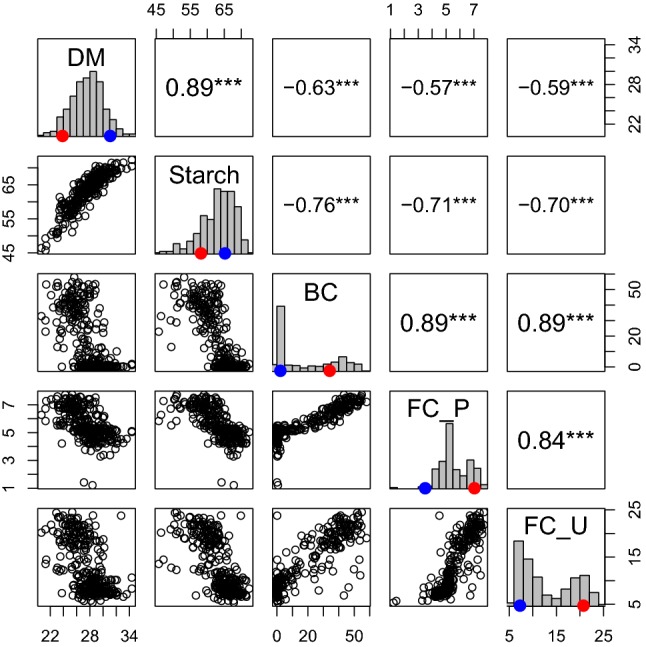
Correlation coefficients (***p < 0.001) among genotypic means for dry matter (DM), starch, β-carotene (BC), flesh color in Peru (FC_P) and Uganda (FC_U). The red and blue dots indicate the mean value of Beauregard and Tanzania, respectively

Correlation coefficients (***p < 0.001) among genotypic means for dry matter (DM), starch, β-carotene (BC), flesh color in Peru (FC_P) and Uganda (FC_U). The red and blue dots indicate the mean value of Beauregard and Tanzania, respectively