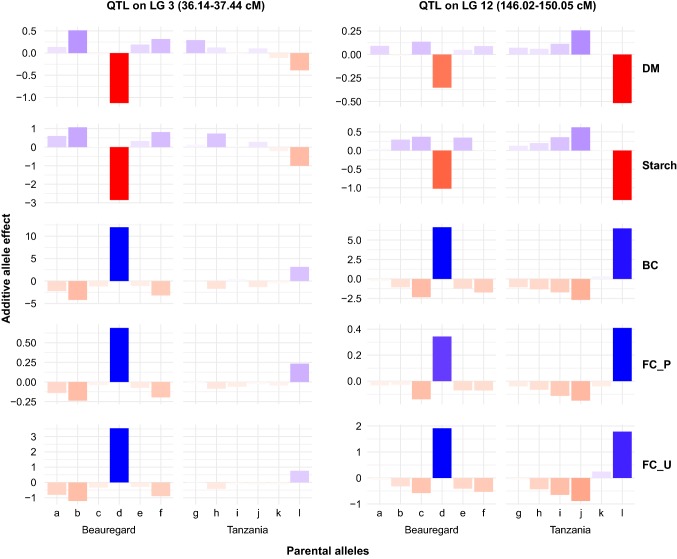
Fig. 3.
Additive allele effect estimates for co-localized QTL on LG3 and LG12 (map position of the QTL peaks in parenthesis) for dry matter (DM), starch, β-carotene (BC), and flesh color in Peru (FC_P) and Uganda (FC_U). Letters a through f and g through l represent the six haplotypes for the specific QTL for Beauregard and Tanzania, respectively

